. 2024 Nov 7;12(11):e010145. doi: 10.1136/jitc-2024-010145

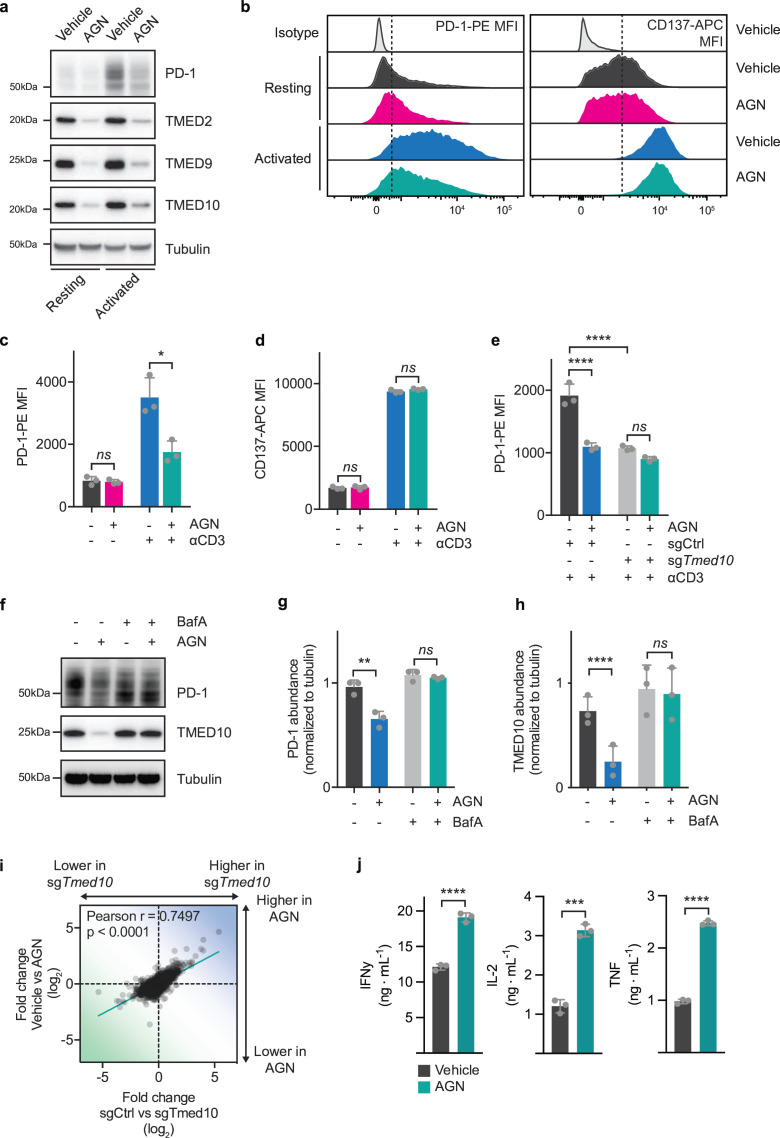
Figure 3. AGN192403 reduces PD-1 abundance and enhances CD8 T cell activity by lysosomally degrading PD-1-TMED10 complex. (a) Western blot analysis of PD-1, TMED10, TMED9 and TMED2 in OT-I/Cas9 CD8 T cells before or after activation with CD3 antibody for 24 hours in the presence or absence of AGN192403 (100 µM). The size markings indicate the size of the closest molecular weight marker. (b) Representative flow cytometry histograms of PD-1-PE (left) or CD137-APC (right) of resting or anti-CD3-activated OT-I/Cas9 CD8 T cells treated, or not, with AGN192403 (AGN; 100 µM) for 24 hours. (c) Quantification of samples in (b) for PD-1-PE abundance. Each data point indicates data obtained with CD8 T cells from an independent spleen. Error bars denote SD. Statistical analysis was performed with a one-way ANOVA, followed by a Tukey post hoc test. (d) As in (c) but for CD137-APC abundance. (e) Quantification of PD-1-PE abundance by flow cytometry for OT-I/Cas9 CD8 T cells carrying an sgRNA targeting Tmed10 or a non-targeting control sgRNA after activation with CD3 antibody, in the presence or absence of AGN192403 (AGN; 100 µM). Each data point indicates data obtained with CD8 T cells from an independent spleen. Error bars denote SD. Statistical analysis was performed with a one-way ANOVA, followed by a Tukey post hoc test. (f) Western blot analysis of PD-1 and TMED10 abundance in OT-I/Cas9 CD8 T cells after activation with CD3 antibody for 24 hours in the presence or absence of AGN192403 (AGN; 100 µM) and/or bafilomycin A1 (100 nM). The size markings indicate the size of the closest molecular weight marker. (g) Quantification of experiment in (f) where PD-1 abundance was normalized to tubulin abundance. Each data point indicates data obtained with CD8 T cells from an independent spleen. Error bars denote SD. Statistical analysis was performed with an RM one-way ANOVA, pairing the data from independent experiments, followed by a Tukey post hoc test. (h) As in (g) but for TMED10 abundance. (i) Correlation plot of transcriptomic changes between activated OT-I/Cas9 CD8 T cells carrying a non-targeting control sgRNA and an sgRNA targeting Tmed10 (x-axis) and activated OT-I/Cas9 CD8 T cells treated with vehicle or AGN192403 (AGN; 100 µM; y-axis). Each data point indicates the relative changes in the expression of a single gene. (j) Cytokine release of IFN-γ (left), IL-2 (middle) and TNF (right) as measured by cytometric bead array of OT-I/Cas9 CD8 T cells after co-culture with B16F10-OVA tumor cells in a 1:4 ratio, in the presence or absence of AGN192403 (AGN; 100 µM). Each data point indicates data obtained with CD8 T cells from an independent spleen. Error bars denote SD. Statistical analysis was performed with a Student’s t-test for each cytokine *p<0.05; **p<0.01; ***p<0.001; ****p<0.0001. ANOVA, analysis of variance; IFN, interferon; IL, interleukin; MFI, mean fluorescence intensity; mean fluorescence intensity; PD-1, programmed cell death protein-1; RM, repeated measures; TNF, tumor necrosis factor.

Figure 3