. 2024 Nov 7;12(11):e010145. doi: 10.1136/jitc-2024-010145

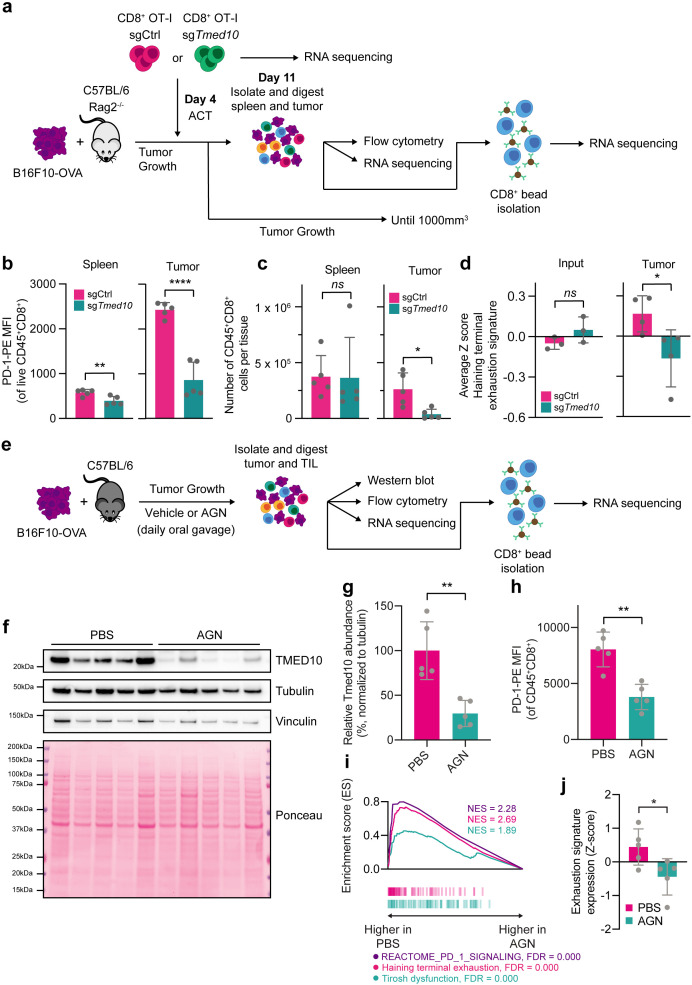
Figure 5. AGN192403 overcomes dysfunction in tumor-infiltrating CD8 T cells. (a) Schematic representation of ACT experiment and downstream analyses. (b) Quantification of PD-1-PE abundance by flow cytometry of tumor-infiltrating CD8 T cells, identified as live, CD45+CD8+, from spleens and tumors from mice that received ACT with sgCtrl or sgTmed10 CD8 T cells. Each data point indicates data obtained with an independent tumor. Error bars denote SD. Statistical analysis was performed with a Student’s t-test for each tissue. (c) Flow cytometry-based quantification of live CD45+CD8+ cells in spleens and tumors from mice in b. Each data point indicates data obtained with an independent tumor. Error bars denote SD. Statistical analysis was performed with a Student’s t-test. (d) The average Z-score expression of the terminal exhaustion signature of the mice in b. Each data point indicates the average signature expression in the CD8+ TIL population of an individual mouse. Error bars denote SD. Statistical analysis was performed with a Student’s t-test for each tissue. (e) Schematic representation of animal experiment and downstream analyses. (f) Western blot analysis of PD-1 and TMED10 in individual tumors treated with PBS or AGN192403 (AGN; 125 mg/kg). The size markings indicate the size of the closest molecular weight marker. (g) Quantification of relative TMED10 abundance of the samples in f. Each data point indicates data obtained with an independent tumor, normalized to tubulin abundance. Error bars denote SD. Statistical analysis was performed with a Student’s t-test. (h) Quantification of PD-1-PE abundance by flow cytometry of tumor-infiltrating CD8 T cells, identified as live, CD45+CD8+, from tumors from mice treated with PBS or AGN192403 (AGN; 125 mg/kg). Each data point indicates data obtained with an independent tumor. Error bars denote SD. Statistical analysis was performed with a Student’s t-test. (i) Gene Set Enrichment Analysis plots of the gene sets REACTOME_PD_1_SIGNALING, Haining terminal exhaustion and Tirosh dysfunction,13 20 comparing CD8+ TIL from animals treated with PBS to those from animals treated with AGN192403 (AGN; 125 mg/kg). (j)13 20 The average Z-score expression of the terminal exhaustion signature. Each data point indicates the average signature expression in the CD8+ TIL population of an individual mouse. Error bars denote SD. Statistical analysis was performed with a Student’s t-test. *p<0.05; **p<0.01; ***p<0.001; ****p<0.0001. ACT, adoptive cell transfer; MFI, mean fluorescence intensity; PBS, phosphate-buffered saline; PD-1, programmed cell death protein-1; OVA, ovalbumin; TIL, tumor-infiltrating lymphocytes.

Figure 5