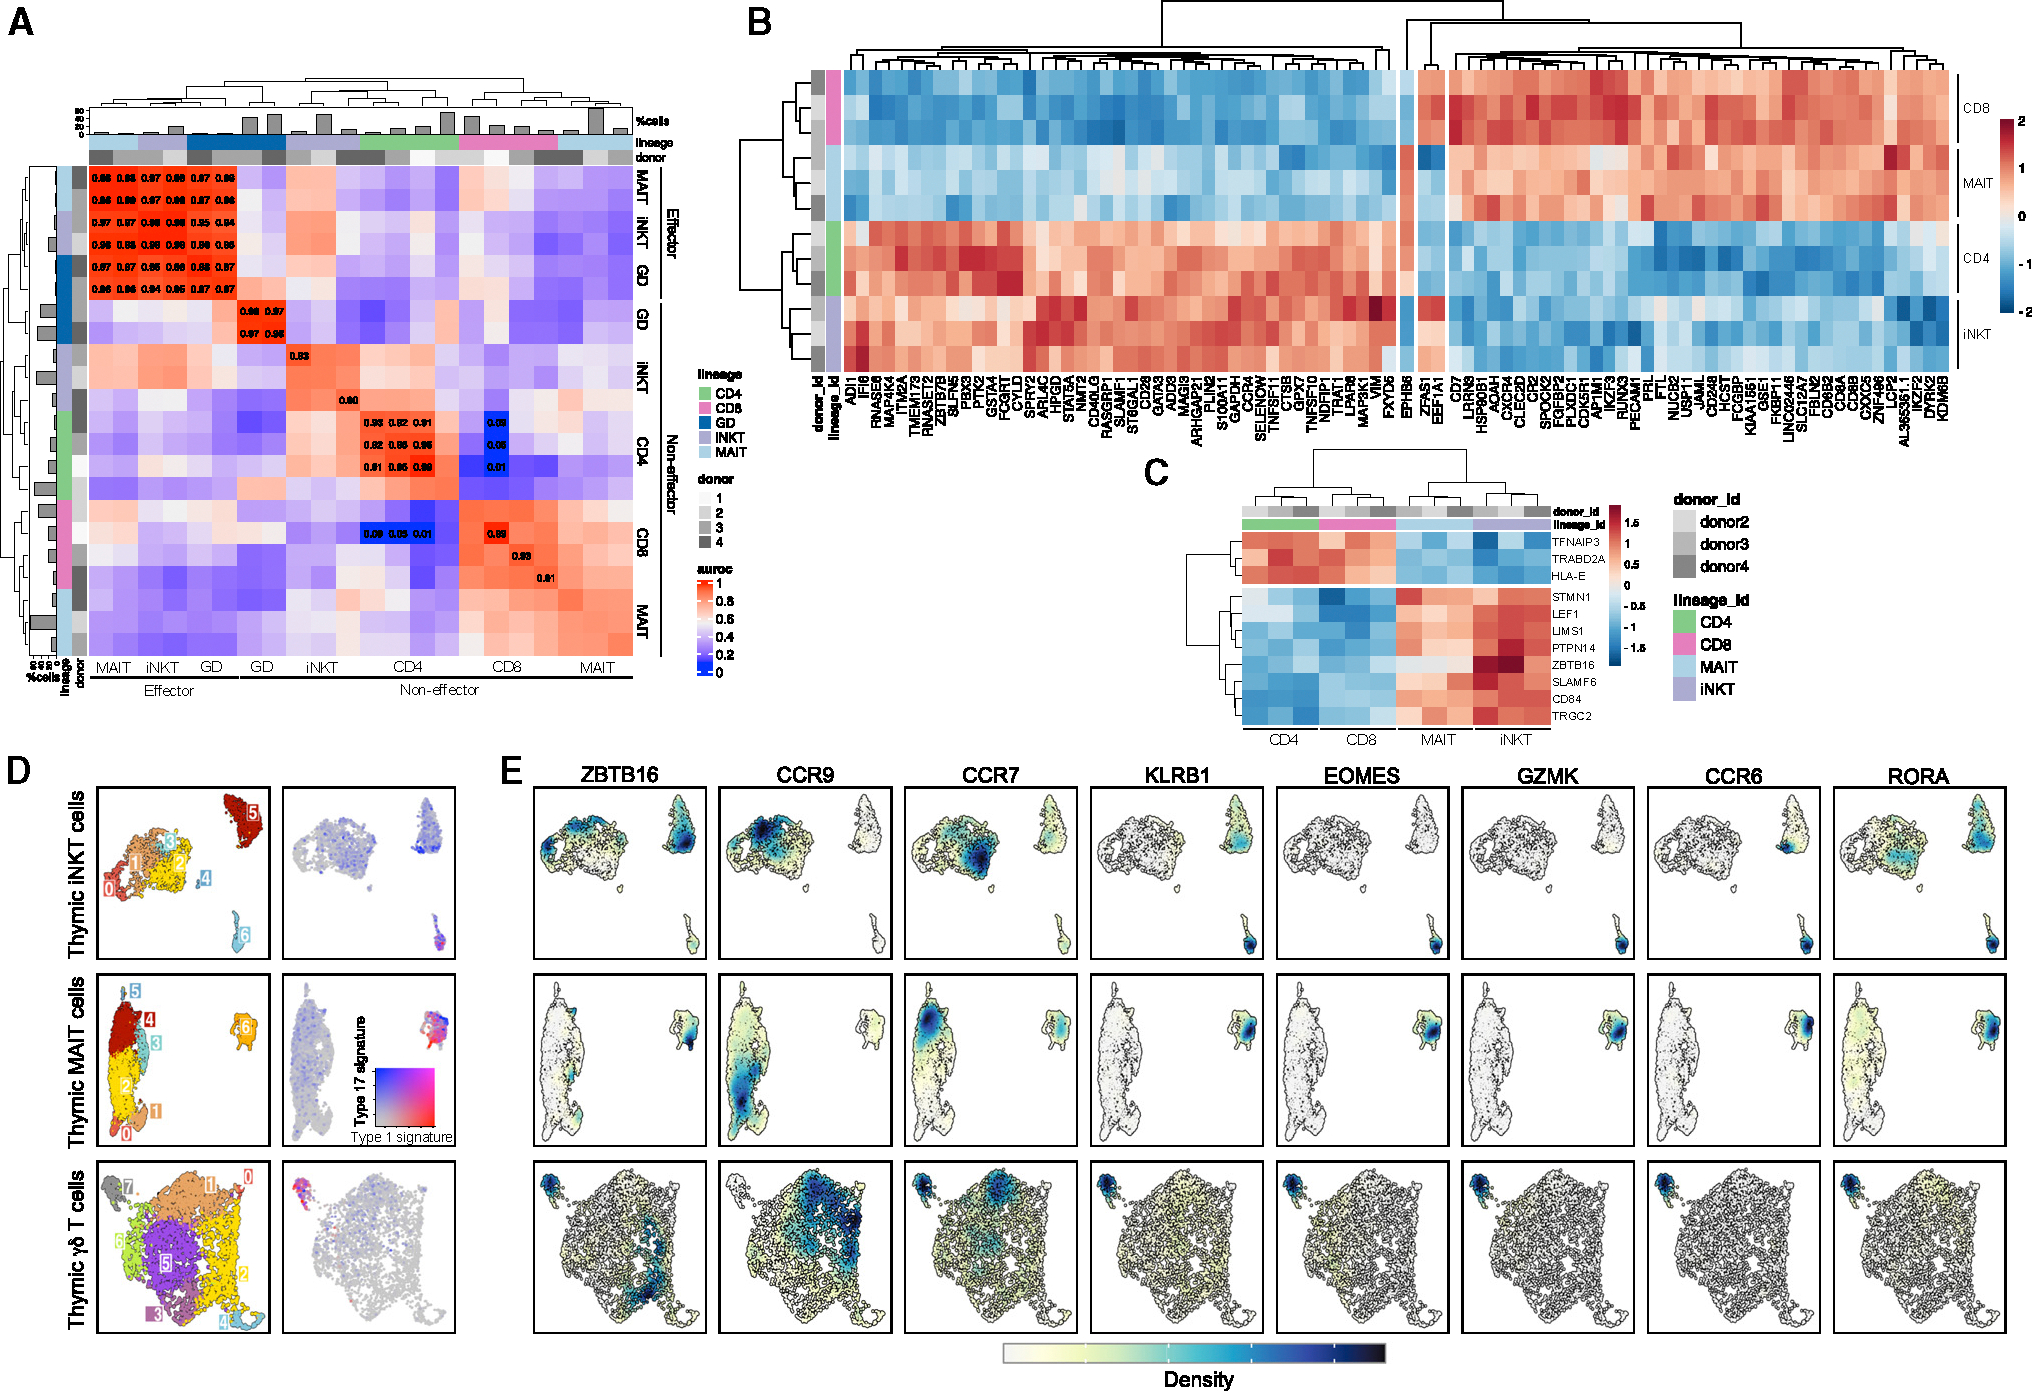
Figure 2. Gene-expression patterns in thymocyte lineages.

(A) Heatmap showing MetaNeighbor’s AUROC scores between thymocytes split by donor, lineage, and non-effector (c0–11) versus effector (c12–17) clusters. Barplots indicate thymocyte proportions per lineage.
(B) Pseudo-bulk differential expression analysis between CD4+/iNKT and CD8+/MAIT thymocytes in naive clusters (3, 9, 10, 11). As a negative control, the only three genes that were differentially expressed between CD4+/MAIT and CD8+/iNKT thymocytes are displayed in the center of the heatmap.
(C) Pseudo-bulk differential expression analysis between CD4+/CD8+ and iNKT/MAIT thymocytes in naive clusters (3, 9, 10, 11). For both (B) and (C), heatmap displays the expression level of genes (represented with color scale as a Z score of the average normalized expression) that are significantly differentially expressed (padj < 0.01).
(D) Clustering of hashtag-separated thymic iNKT cells (top), MAIT cells (middle), and γδ T cells (bottom). Right panel shows the score of type I and type III effector gene signature for the corresponding thymic lineage.
(E) Kernel density estimates of the normalized expression level of genes of interest. The expression level distribution varies between genes and lineage. The range of kernel density estimate values also varies between each panel (from 0 to 0.04 for the smallest range and 0 to 0.4 for the largest range). A unique color scale was represented to indicate the direction of the values.
