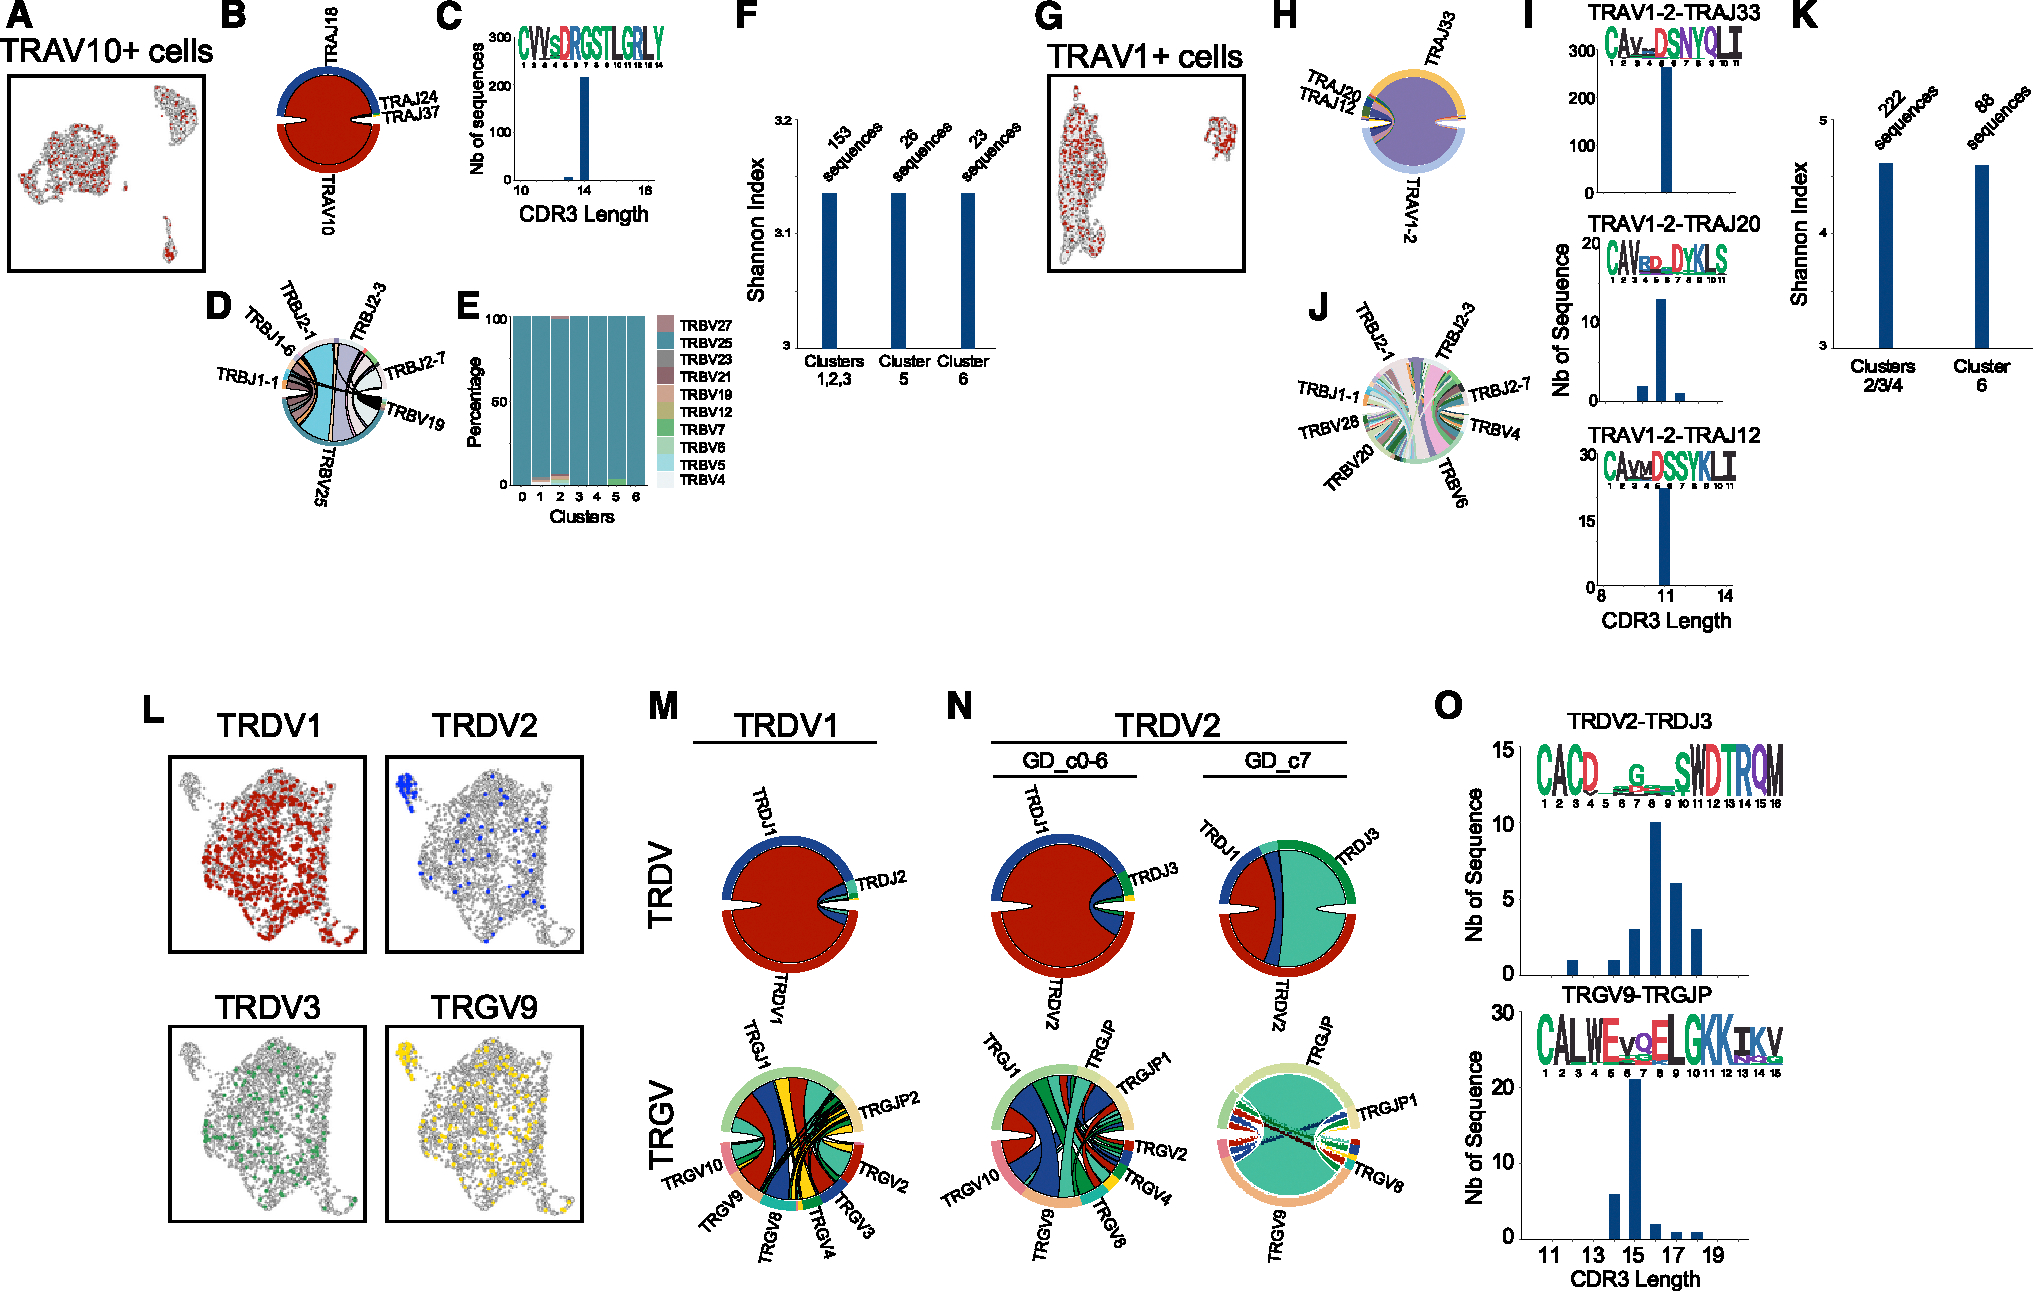
Figure 3. Innate T cell TCR diversity during development.

Cells with VDJ sequencing and their cell-type-specific characteristic chain arrangement for thymic iNKT cells (A), MAIT cells (G), and γδ T cells (L). For each cell type, the respective proportions of gene segment usage in each chain (B and D; H and J; M and N) are shown together with their CDR3 length and sequence logo (C, I, O) and their cluster-specific usage (E, with clusters as in Figure 2A). Shannon index as an estimation of TCR diversity in the naive-like and effector-like iNKT (F) and MAIT (K) cells, based on clusters in Figure 2D. n = 1 human thymus sample for all panels.
