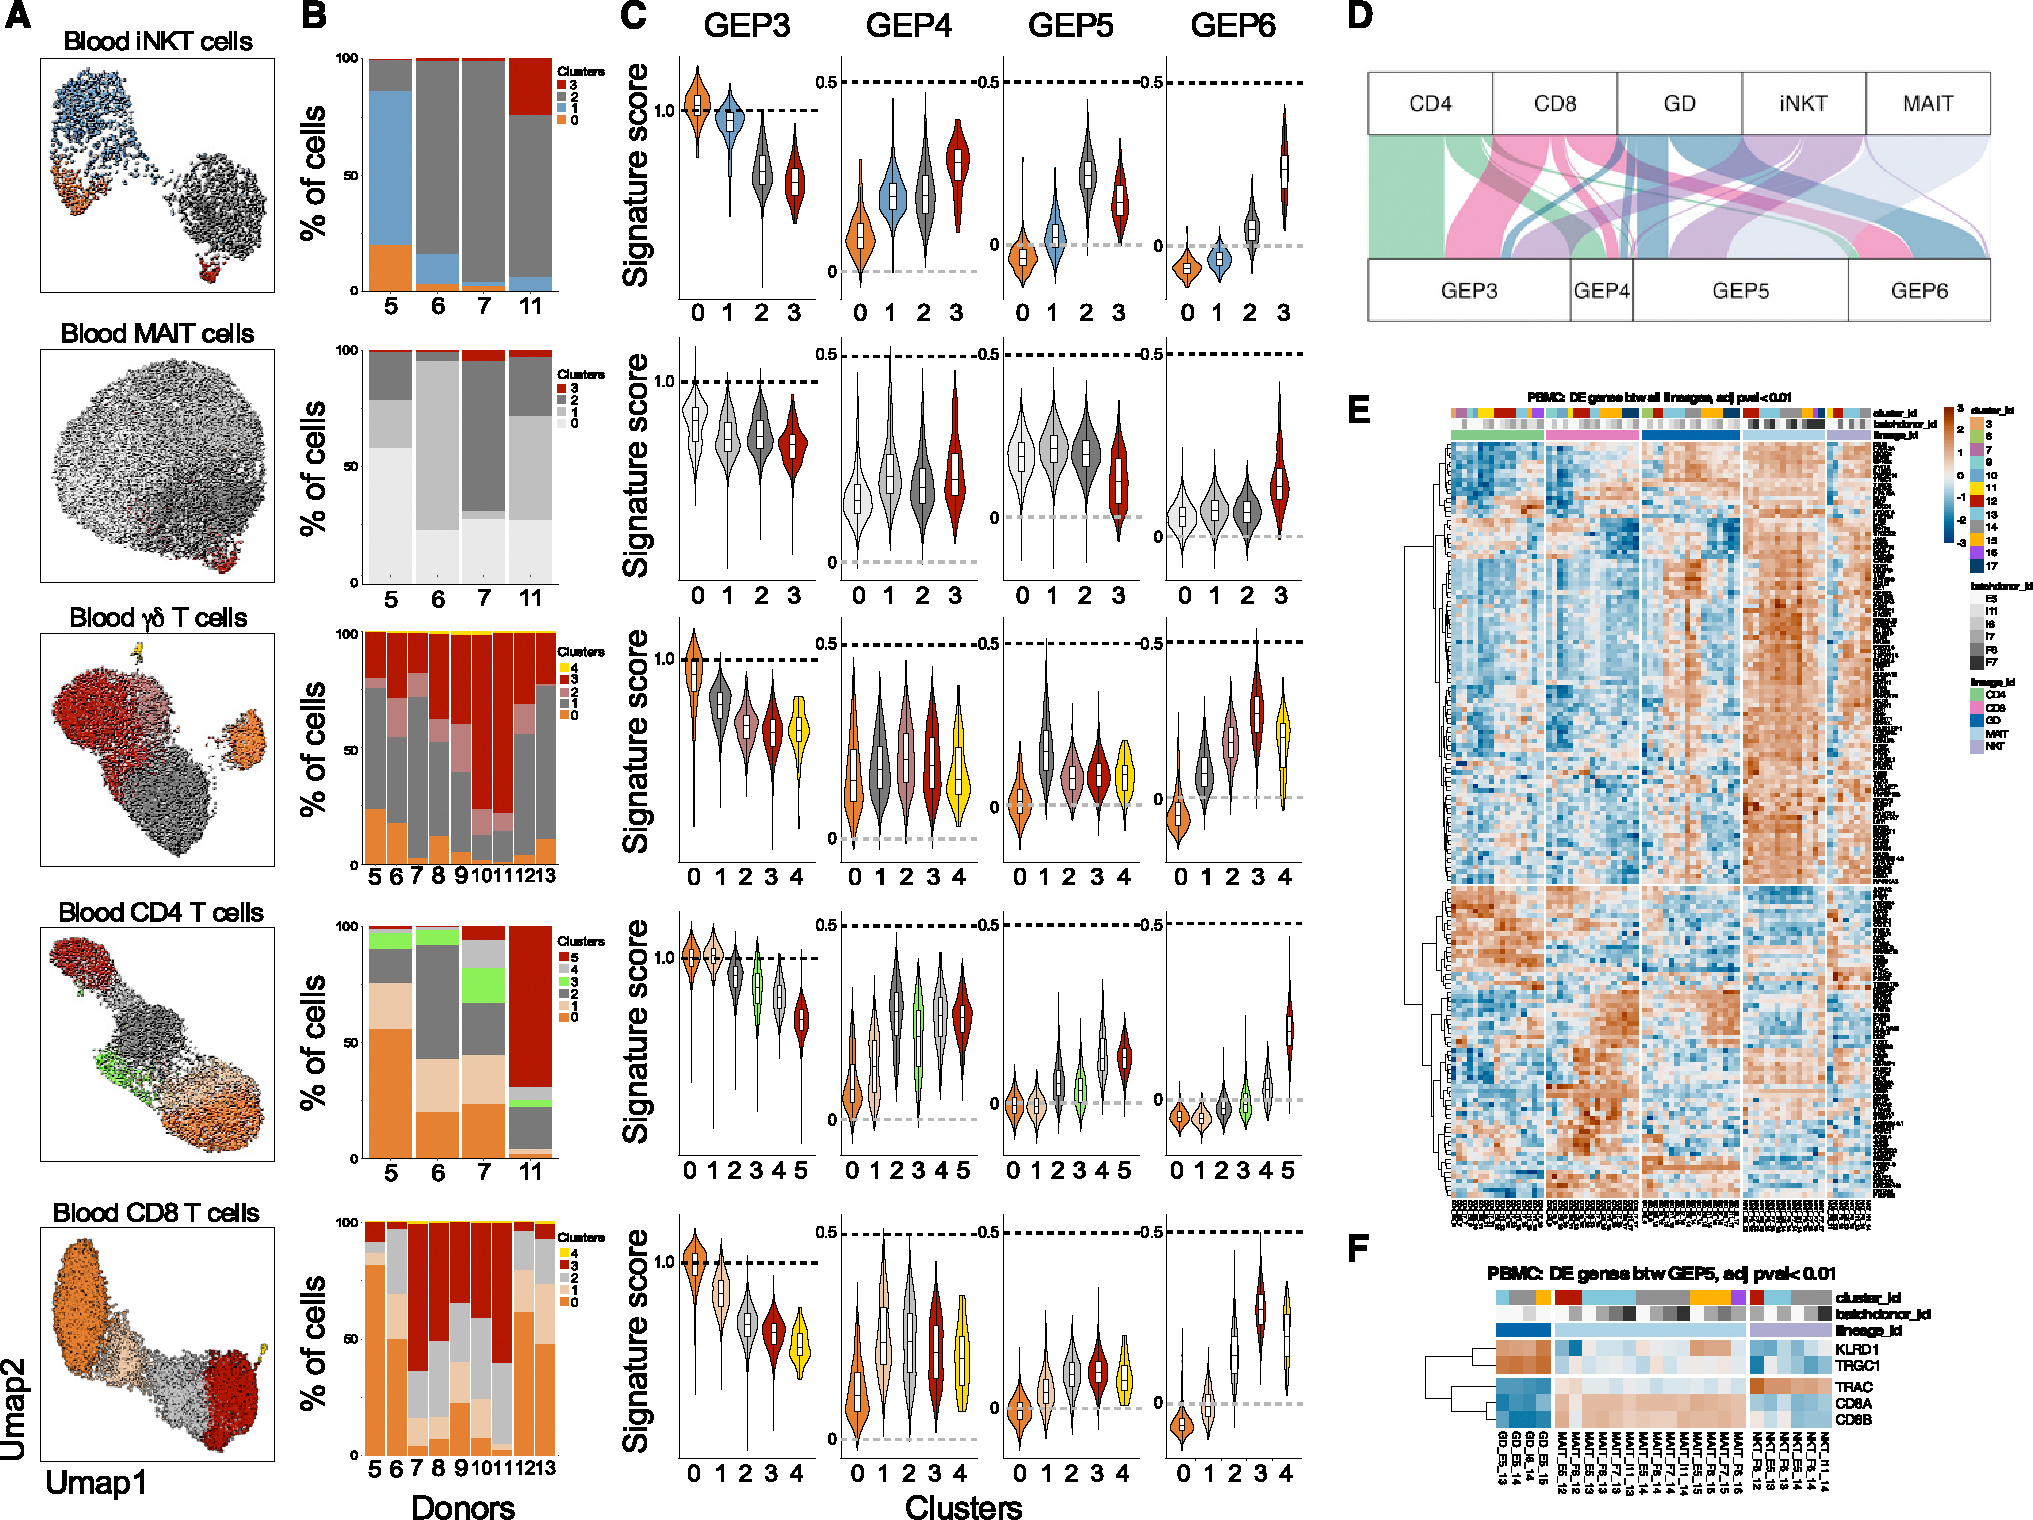
Figure 4. Gene-expression programs in circulating Tinn and Tconv.

(A–C) (A) Clustering of hashtag-separated blood iNKT, MAIT, γδ T, CD4, and CD8 T cells, (B) the respective proportion of cells per cluster and donor, and (C) the effector GEP signature scores (as in Figure 1K) per cell type and cluster.
(D) Top GEP usage for each cell type, based on cNMF-derived usage matrix.
(E) Pseudo-bulk, pairwise differential gene expression between cell types.
(F) Cell-type-specific genes among Tinn cells using GEP5. For both (E) and (F), heatmaps depict the expression level of genes (represented with color scale as a Z score of the average normalized expression) that are significantly differentially expressed (padj < 0.01). n = 4, 4, 9, 4, and 9 for iNKT, MAIT, γδ, CD4, and CD8 cells, respectively.
