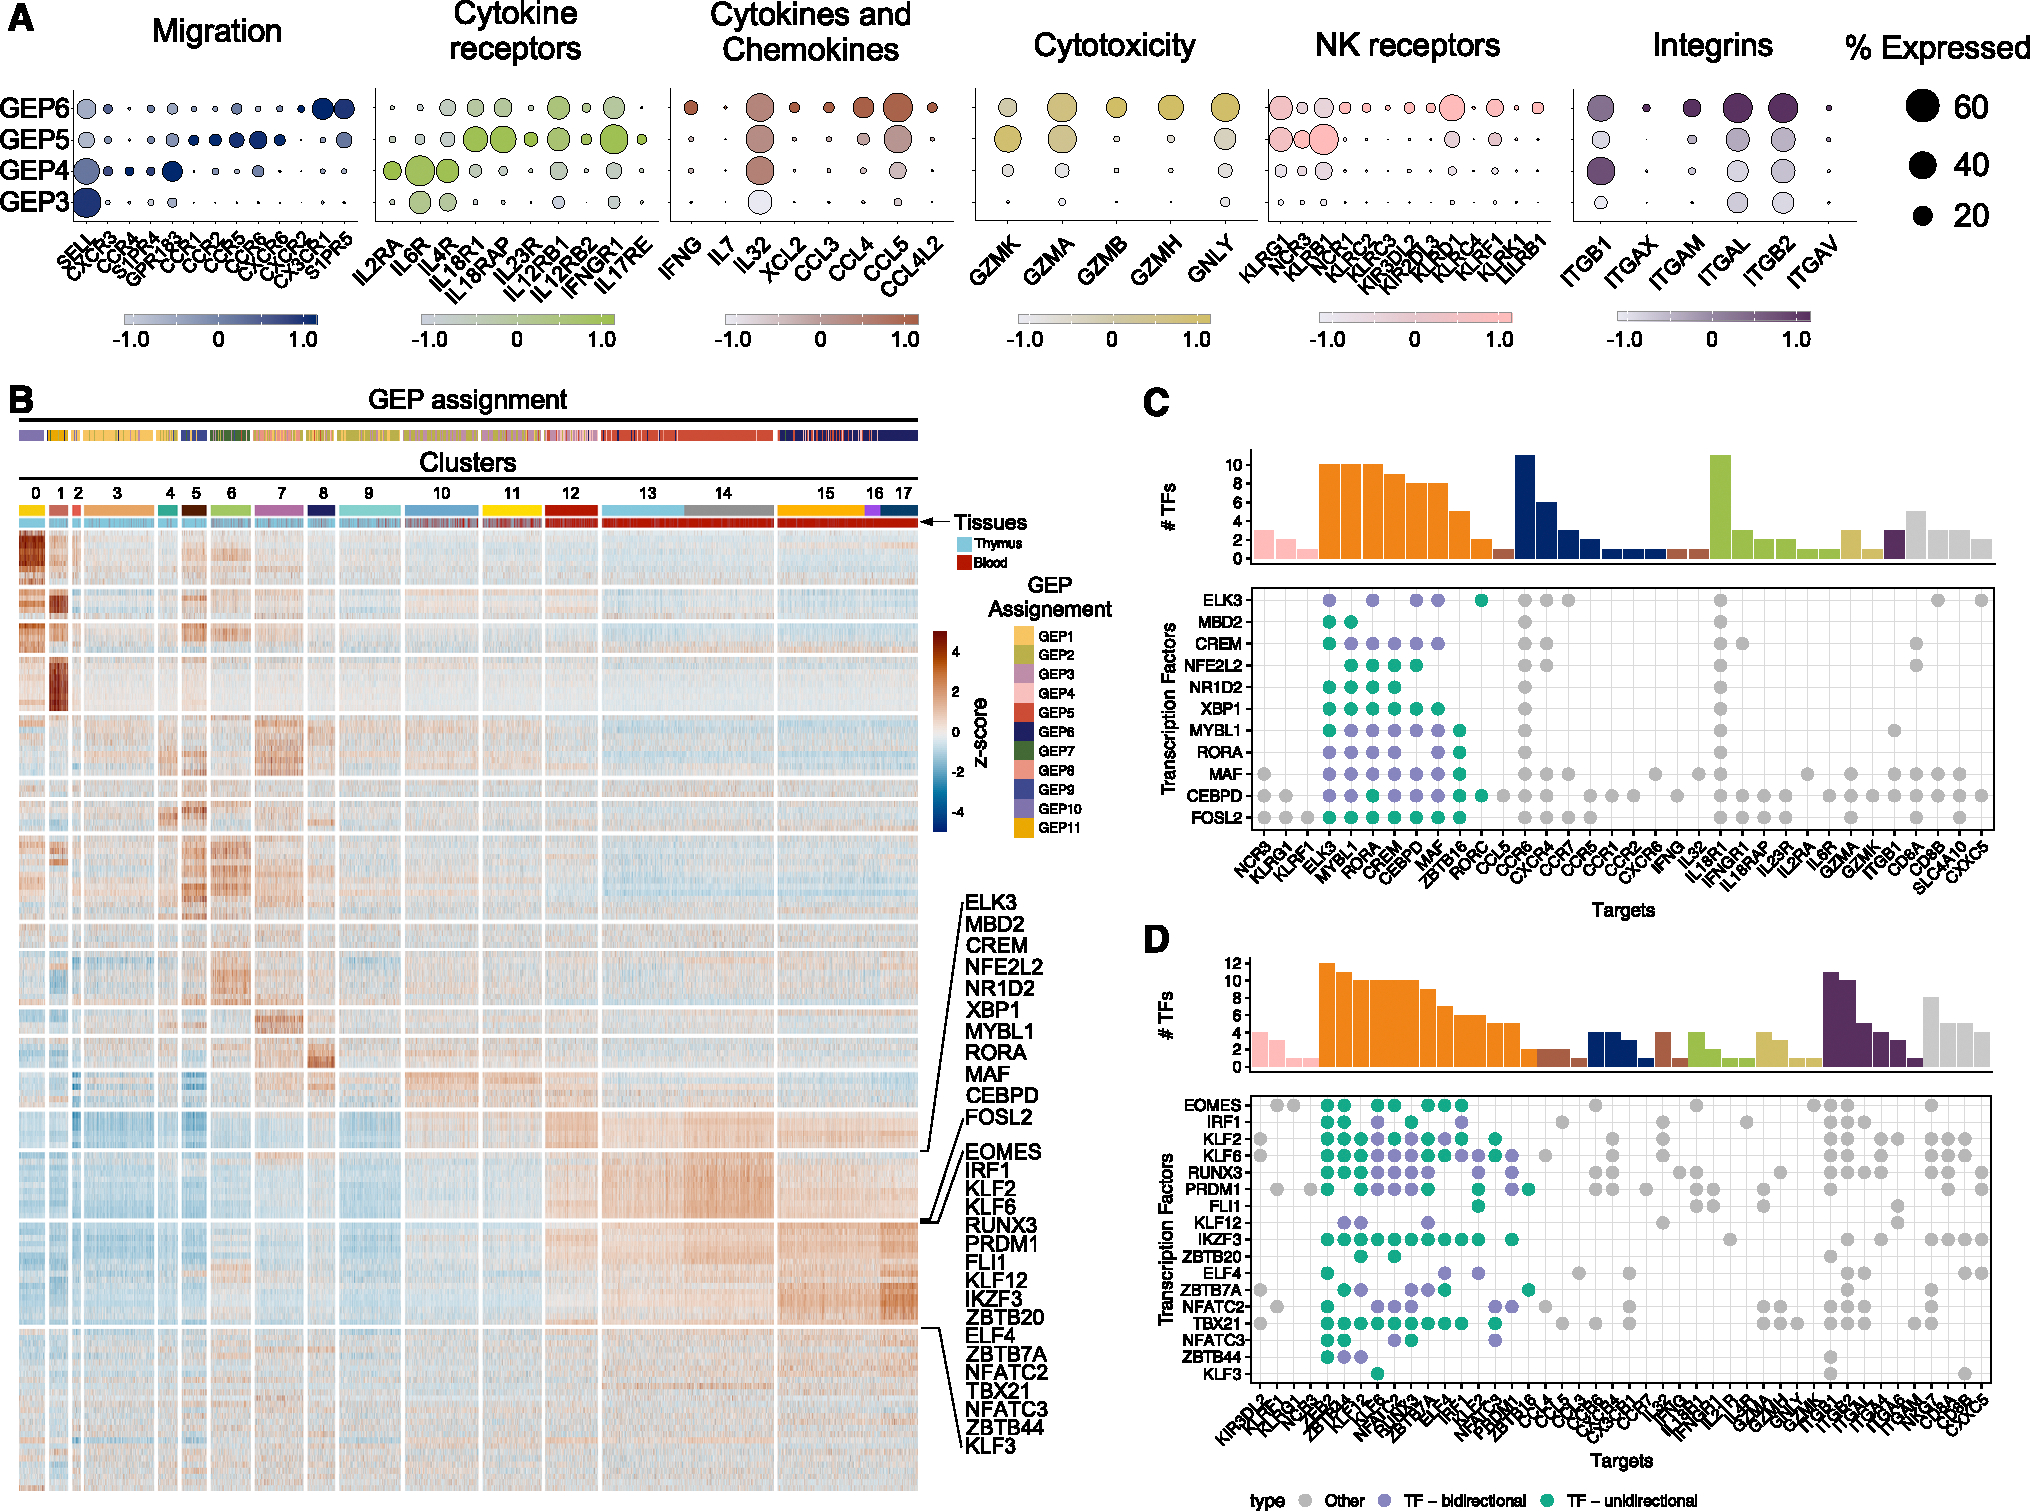
Figure 5. Effector gene-expression programs in Tinn and Tconv.

(A) Key genes categorized by function and depicted by their expression level (Z-score color scale) and percentage of expression in cells belonging to the indicated GEPs.
(B–D) (B) Single-cell regulatory network inference and clustering of TFs and enrichment score per cell (as row-scaled Z scores), ordered by cluster (as in Figure 1C), with tissue of origin and GEP assignment (based on cNMF usage) indicated by color bar. Two row clusters are marked, which are preferentially enriched in Tinn (upper bracket) and Tconv (lower bracket). (C and D) TFs with pronounced activity in (C) Tinn and (D) Tconv (corresponding to brackets in B) and their targets. Green dots indicate TFs (y axis) that have other TFs as their target (x axis), where purple labels TFs that can interact in either direction. The marginal bar chart shows the number of TFs per target, color coded by their functional categorization (as in A).
