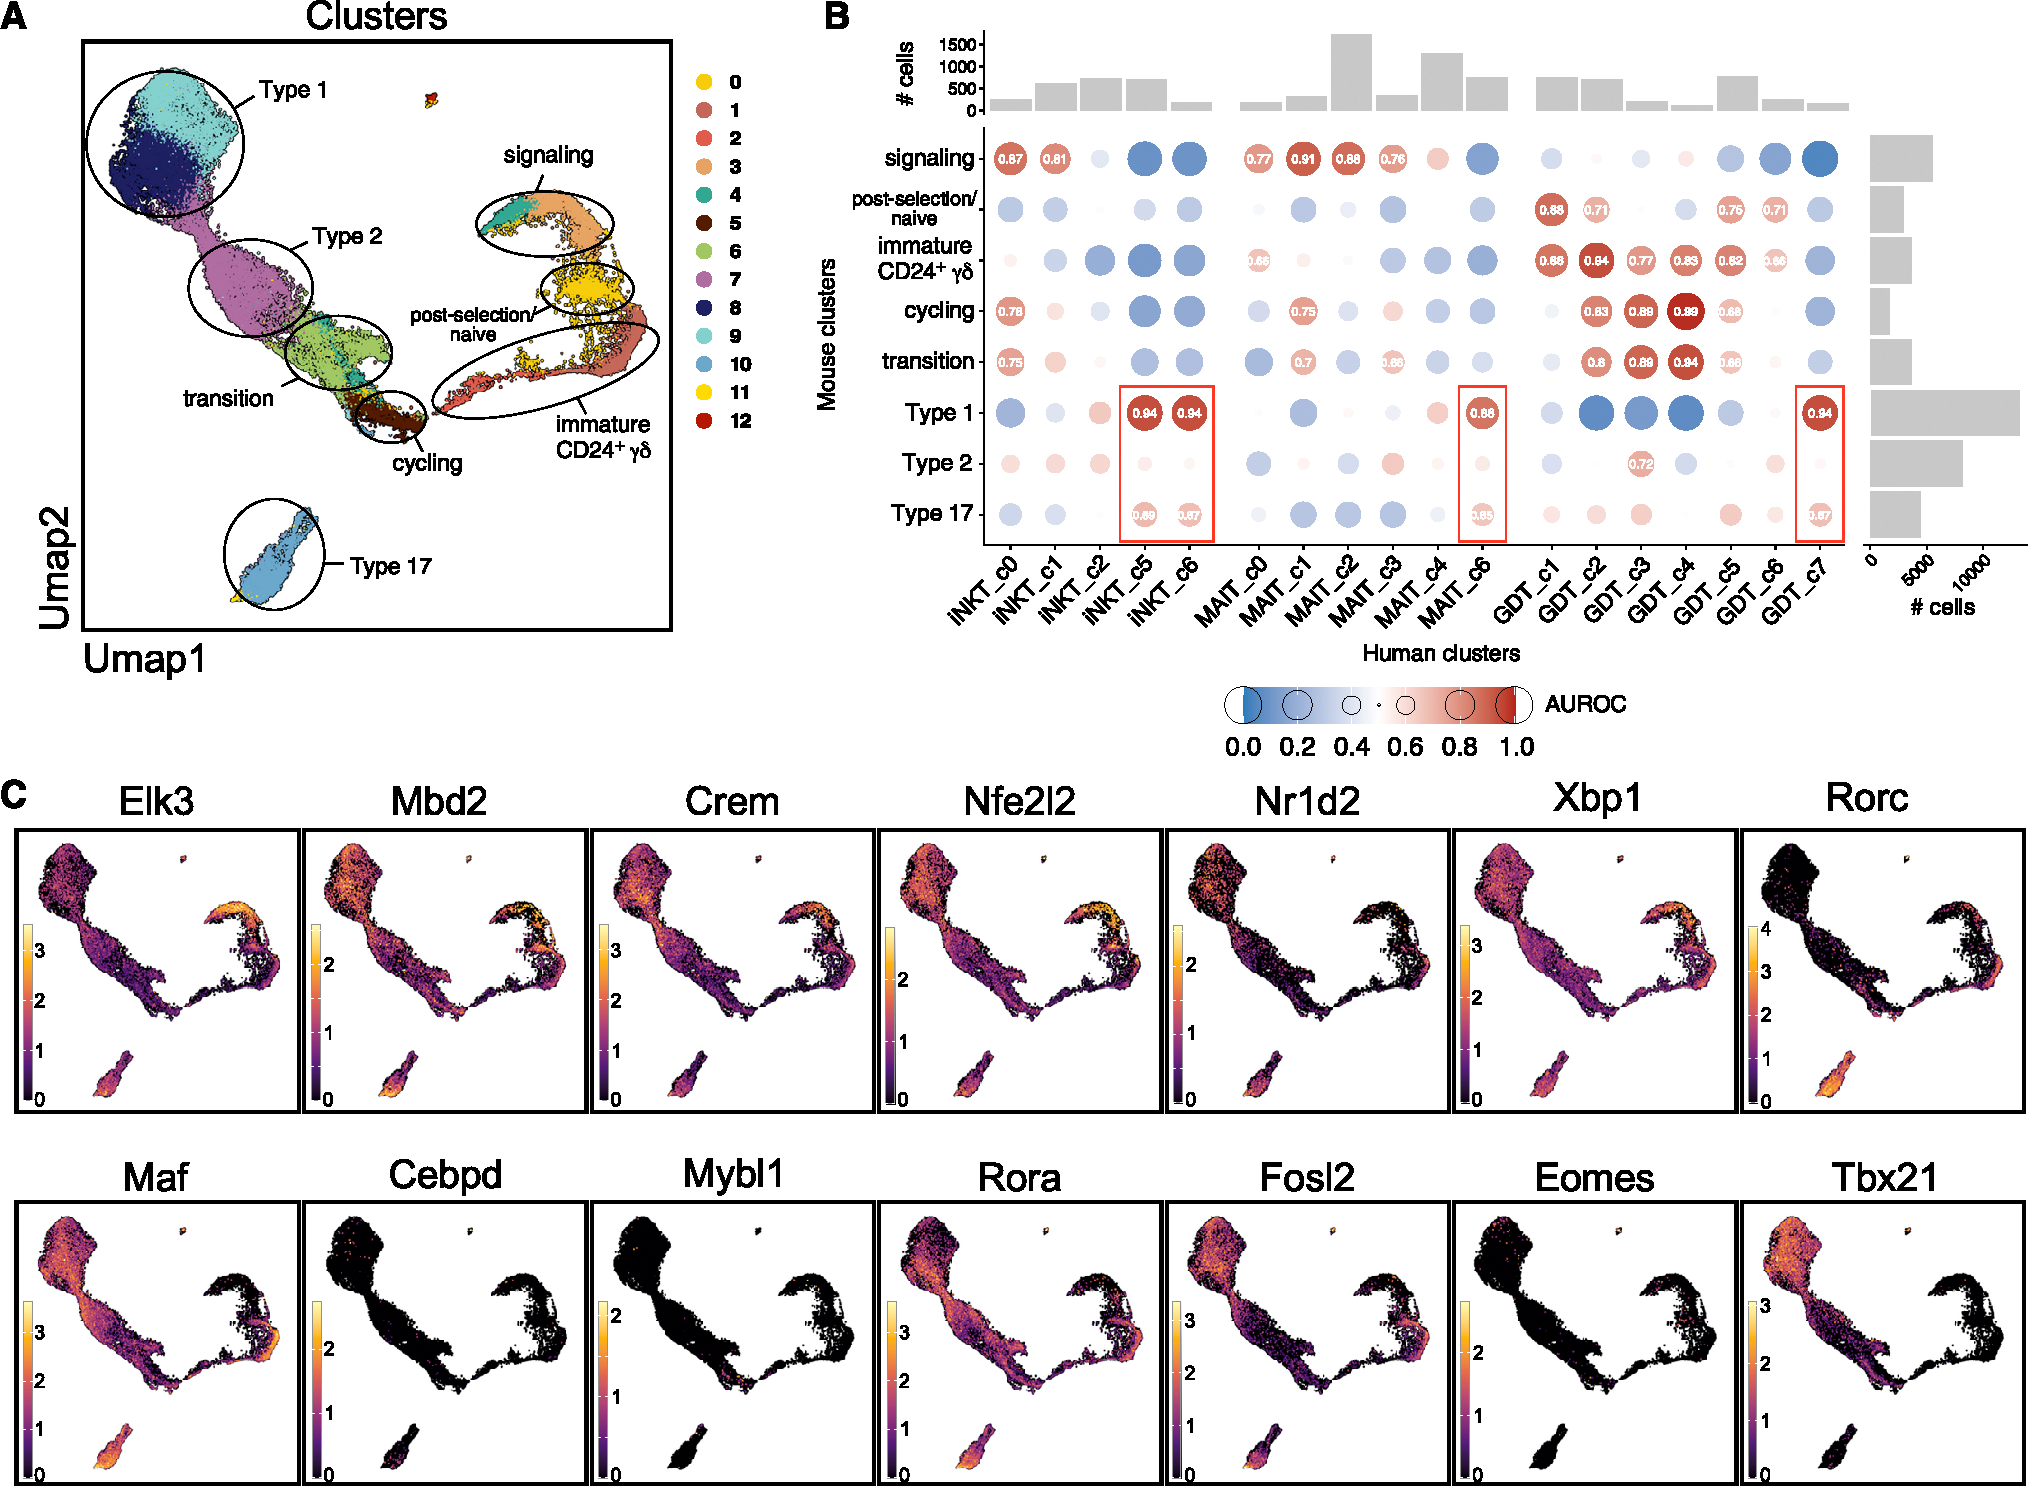
Figure 6. Cross-species comparison of mouse and human Tinn development.

(A) Mouse Tinn reference atlas with seven characteristic cell states highlighted, which are found across lineages (as in Figure S15).
(B) MetaNeighbor analyses showing pairwise correspondence (AUROC scores) between murine Tinn (as in A) and human iNKT, MAIT, and γδ T cell clusters (as in Figure 2D). Marginal bar charts indicate number of cells in the corresponding clusters.
(C) Expression of human regulon-driving TFs (as in Figure 5) together with murine TFs of importance in Tinn development (Rorc, Tbx21) projected on mouse Tinn reference atlas (as in A).
