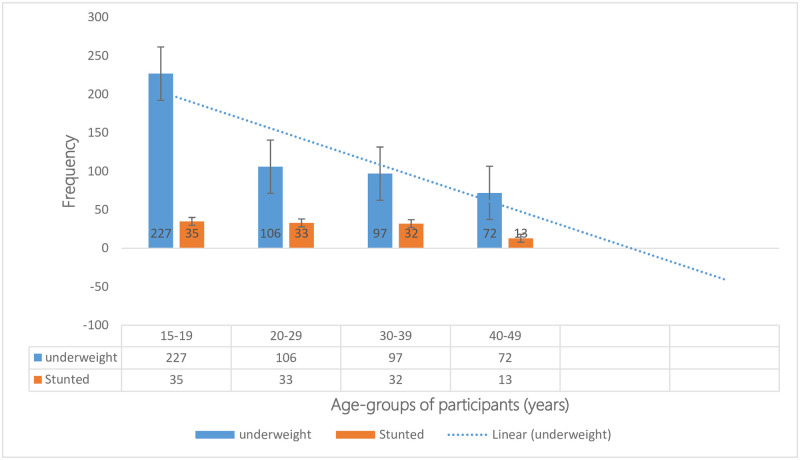
Fig 3. Frequency of underweight among different age groups of women (15–49 years) in the 2019 SLDHS.
Fig 3 shows the frequency of underweight as it decreased with age group populations, with the majority in the 15-19-year age group 45.2%(227/502), followed by the 20-19-year age group, 21.1%(106/502); 30-39-year age group 19.3%(97/502), and least among the 40-49-year age group 14.3%(72/502). The data source is SLDHS of 2019.

