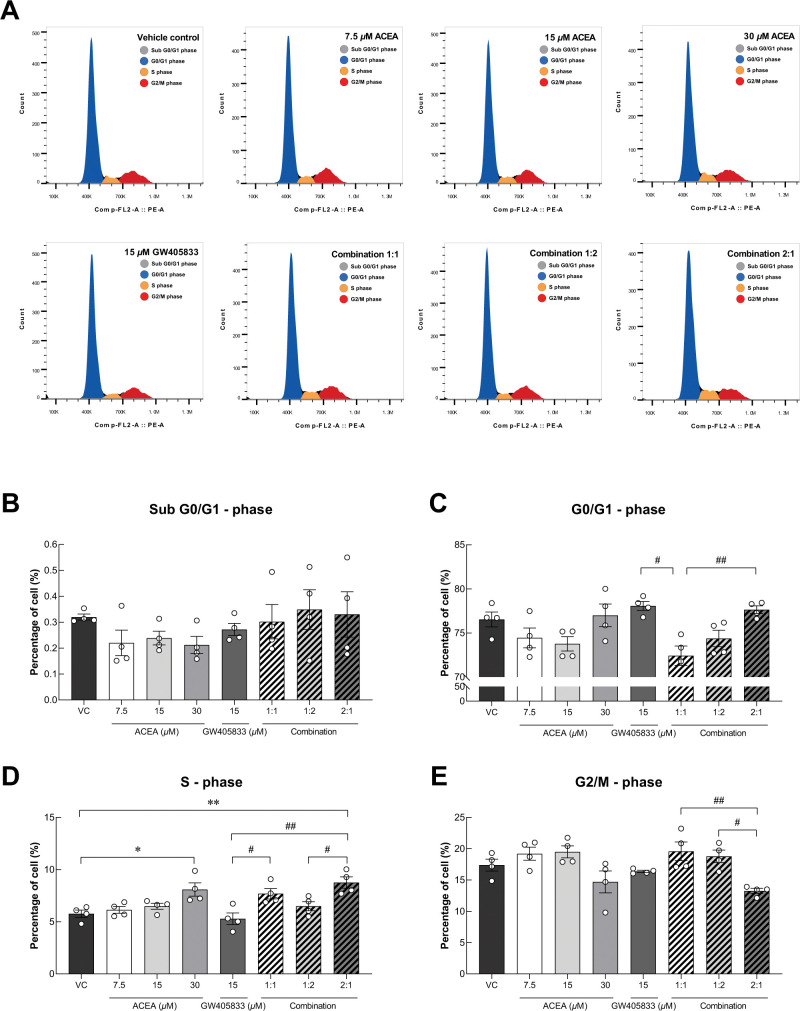
Fig 2. MDA-MB-231 cell cycle distribution after CB agonist treatment were evaluated.
(A) Scatter plot of cells in different cell cycle phases stained with 20 μg/mL PI after 48 hours of CB agonist treatment. Quantitative results of cell distribution in each cell cycle phases (B) Sub G0/G1 phase, (C) G0/G1 phase, (D) S phase, (E) G2/M phase were presented as mean ± SEM from four independent biological replicates. (*p < 0.05, **p < 0.01, while #p < 0.05, ##p < 0.01).

