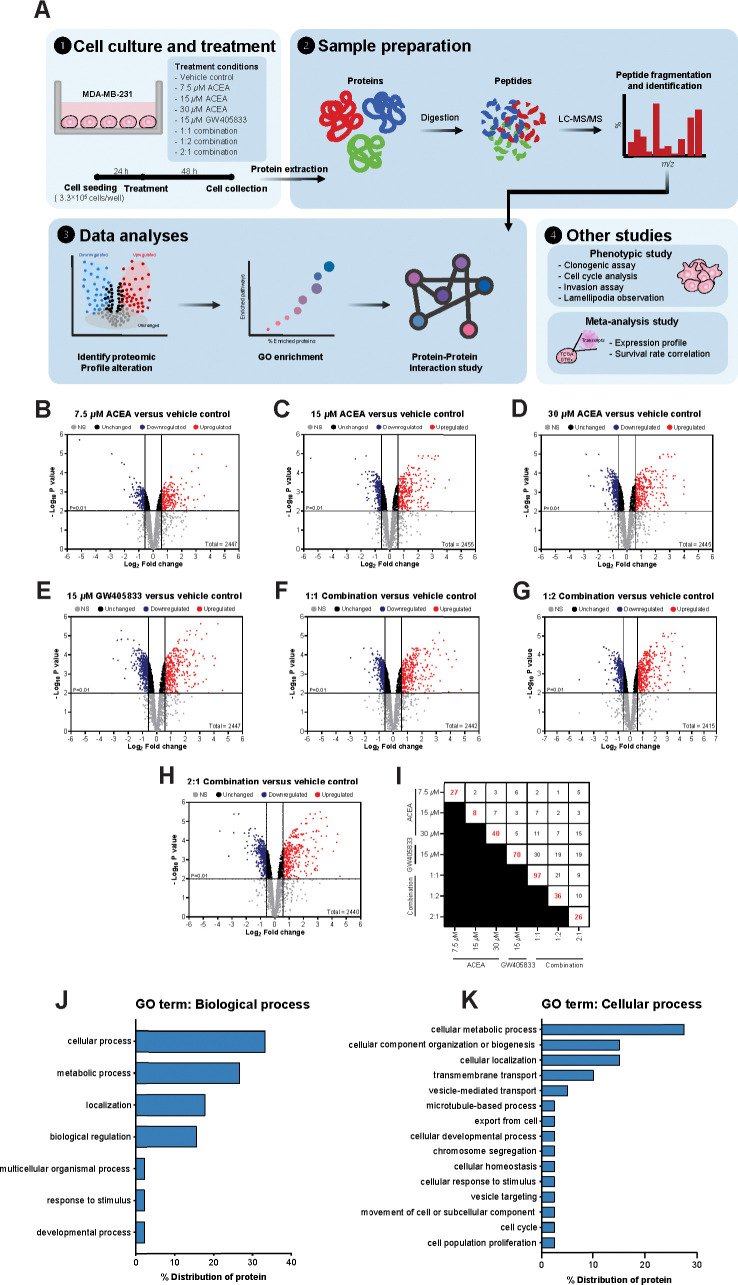
Fig 3. Proteomic analyzed signature profiles of MDA-MB-231 exposed to different combinations of CB agonists.
(A) The schematic workflow of proteomic profile study of MDA-MB-231 treated with CB agonists. Volcano plot of differential protein expression shows a negative base 10 log of the adjust p-values plotting against the base 2 log of the fold change of each protein in CB agonists treated group normalized to control, (B) 7.5 μM ACEA; (C) 15 μM ACEA; (D) 30 μM ACEA; (E) 15 μM GW405833; (F) 1:1 combination; (G) 1:2 combination; (H) 2:1 combination, versus vehicle control group. (I) Chart showed the unique proteins after exposed to CB treatments. The GO term enrichment analysis (J) biological process and (K) cellular process.

