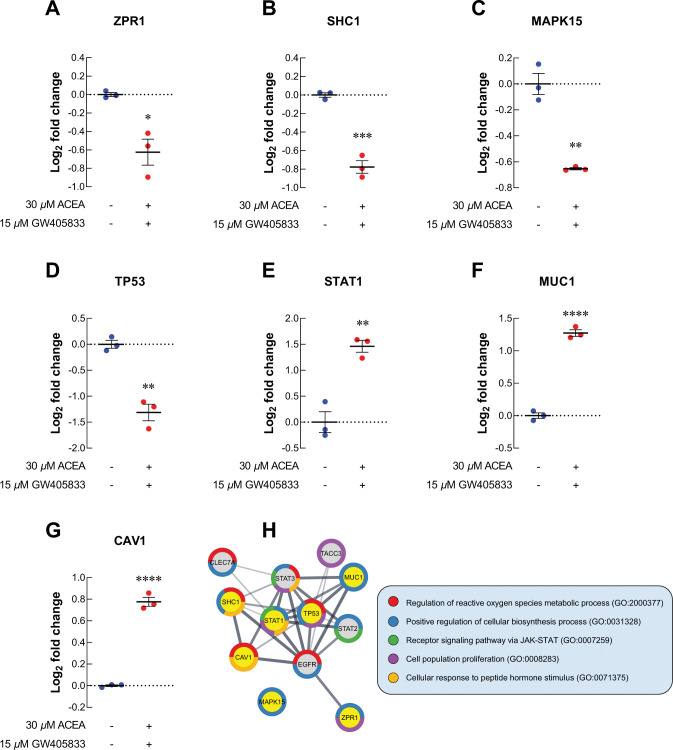
Fig 4. Proteomics study revealed the alteration of uniquely related proteins to cell proliferation in MDA-MB-231.
The level of cell cycle and proliferation related proteins after exposed to 2:1 combination treatment expressed by log2 fold change of each protein in CB agonists treated group normalized to control (A) ZPR1; (B) SHC1; (C) MAPK15; (D) TP53; (E) STAT1; (F) MUC1; (G) CAV1; (H) Protein-protein interaction diagram of changed cell proliferation-related proteins in MDA-MB-231 treated 2:1 combination. The connected lines indicated the potential direct associations of proteins with the bolder lines represented the stronger interactions. All dot plots were presented as individual log2 fold change ± SEM of three biological replicates. (*p < 0.05, **p < 0.01, ***p < 0.001, ****p < 0.0001).

