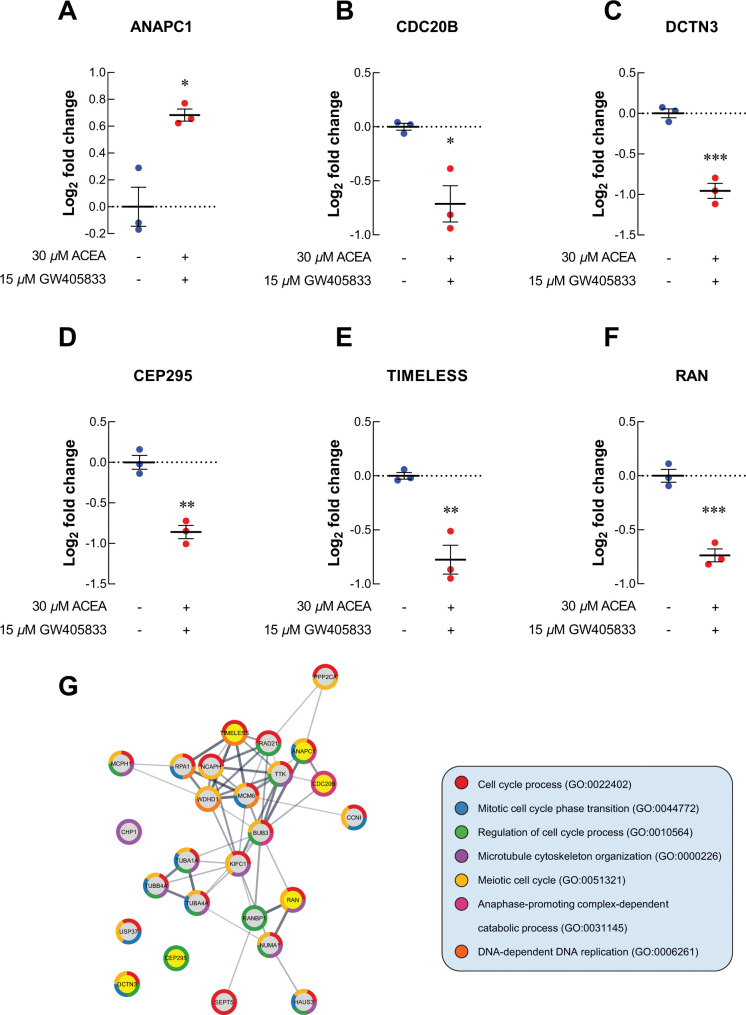
Fig 5. Proteomics study revealed the alteration of uniquely related proteins to cell cycle in MDA-MB-231.
The level of cell cycle-related proteins after exposed to CB agonists and their combination treatment expressed as log2 fold change normalized to control (A) ANAPC1; (B) CDC20B; (C) DCTN3; (D) CEP295; (E) TIMELESS; (F) RAN; (G) Protein-protein interaction diagram of changed proteins in MDA-MB-231 exposed to CB agonists. The connected lines indicated the potential direct associations of proteins with the bolder lines represented the stronger interactions. All dot plots were presented as individual log2 fold change ± SEM of three biological replicates. (*p < 0.05, **p < 0.01, ***p < 0.001).

