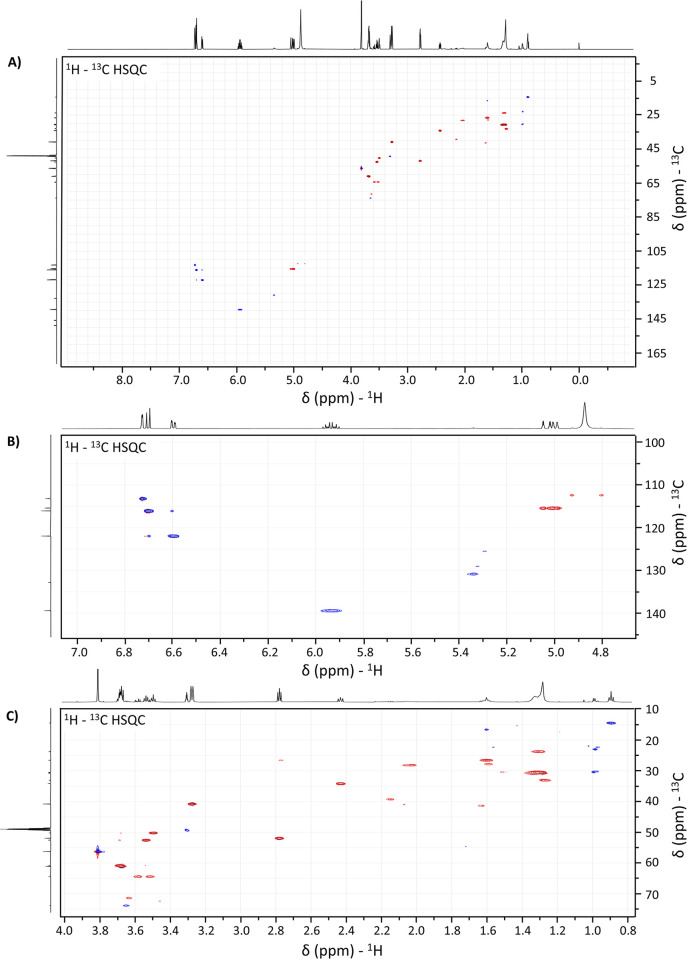
Fig 4. 1H–13C Heteronuclear Single Quantum Correlation spectrum of CO:AM60 binary mixture.
Full 1H – 13C HSQC spectra of the 1:1 binary mixture of CO and AM60 (A). Zoom regions for correlations between (B) 1H signals from 4.7 to 7.0 ppm with 13C signals from 100 to 145 ppm and (C) 1H signals from 0.8 to 4.0 ppm with 13C signals from 10 to 75 ppm.

