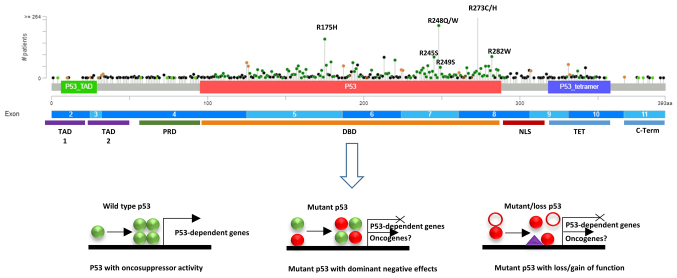
Figure 3.
Lollipop plot produced by the MutationMapper tool of cBioPortal shows the frequency and position of TP53 mutations in 10953 tumours from 32 studies. Domain organization of p53 is also described, followed by the C-terminus containing the nuclear export signal. TAD, transactivation domain; PRD, proline rich domain; DBD, DNA binding domain; NLS, nuclear localization signal; NLS, nuclear localization signal; TET, tetramerisation domain.

