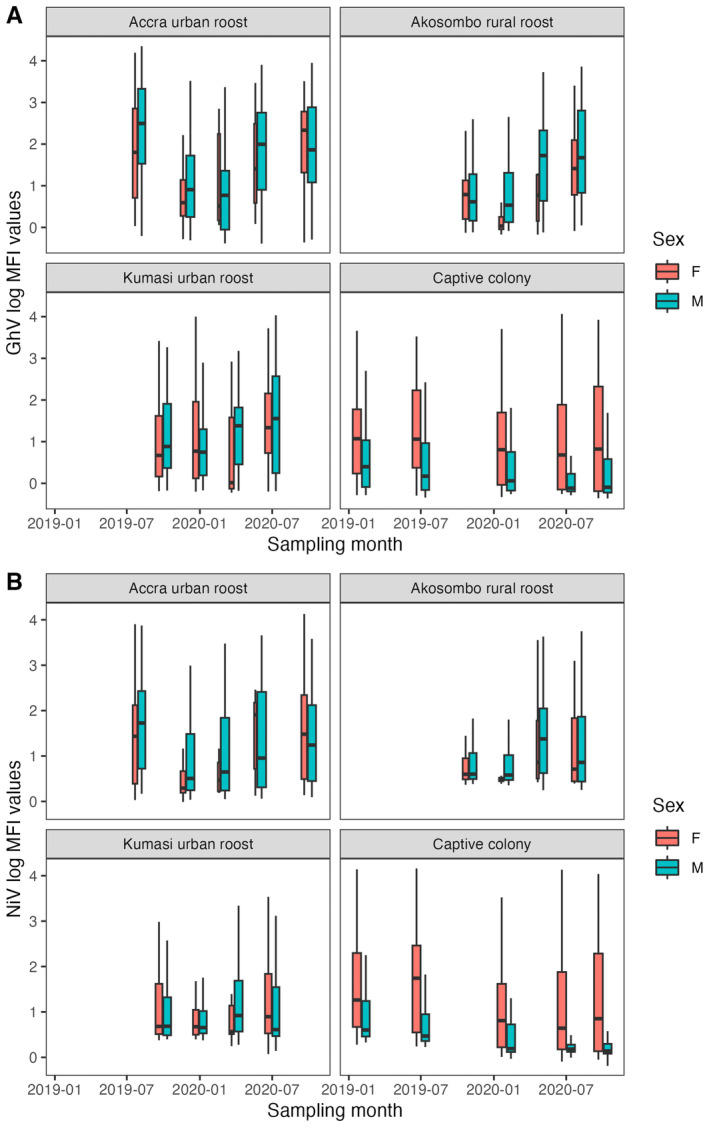
FIGURE 2.

(A) GhV log‐MFI values at each of the four sites across the sampling period, colour coded by sex. (B) NiV log‐MFI values at each of the four sites across the sampling period, colour coded by sex. The width of each box is proportional to the sample size.
