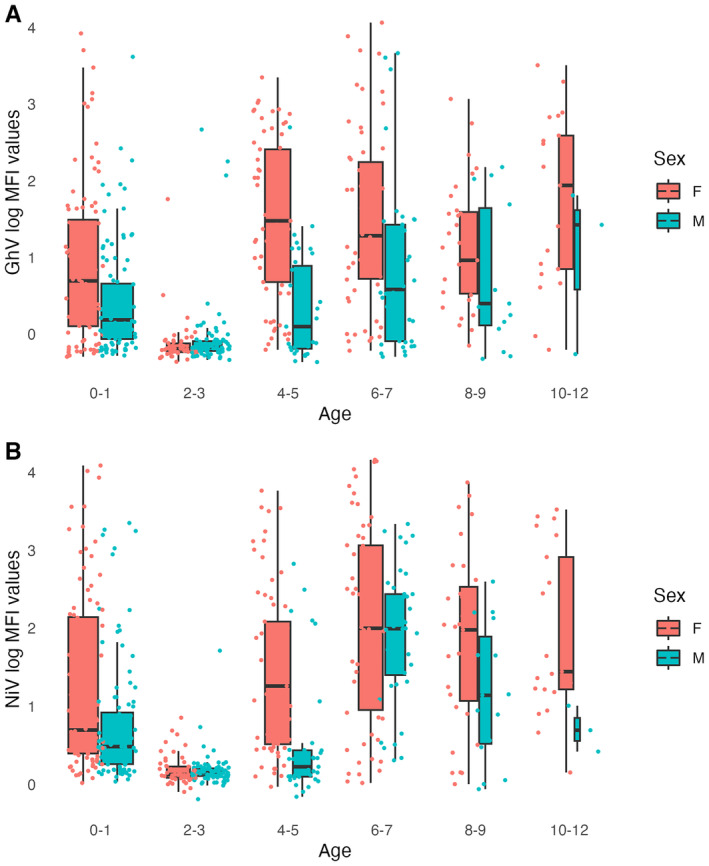
FIGURE 4.

(A) Boxplot of GhV log‐MFI values by age and sex in the captive colony. (B) Boxplot of NiV log‐MFI values by age and sex in the captive colony. The width of each box is proportional to the sample size and jittered points represent individual bats. Results for HeV, MojV and CedV are presented in Figure S4.
