
Figure 1.
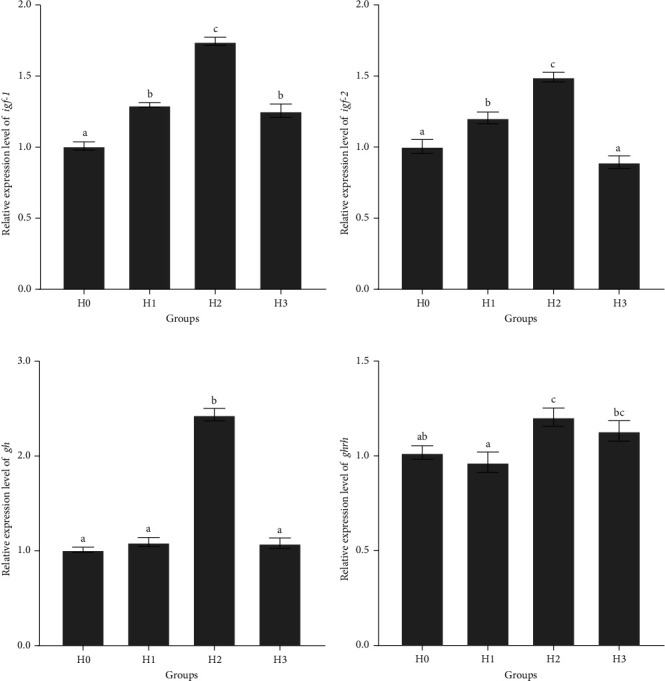
The relative expressions of igf-1 (A), igf-2 (B), gh (C), and ghrh (D) in the brain. igf-1, insulin-like growth factor 1; igf-2, insulin-like growth factor 2; gh, growth hormone; ghrh, growth hormone-releasing hormone. H0, basal diet; H1, basal diet + 0.05% hydrolyzable tannin; H2, basal diet + 0.1% hydrolyzable tannin; H3, basal diet + 0.2% hydrolyzable tannin. The letters in the results indicate the outcomes of multiple-range tests. The different letters indicate significant differences (p < 0.05), while the same letter indicates no significant differences (p > 0.05).