
Figure 2.
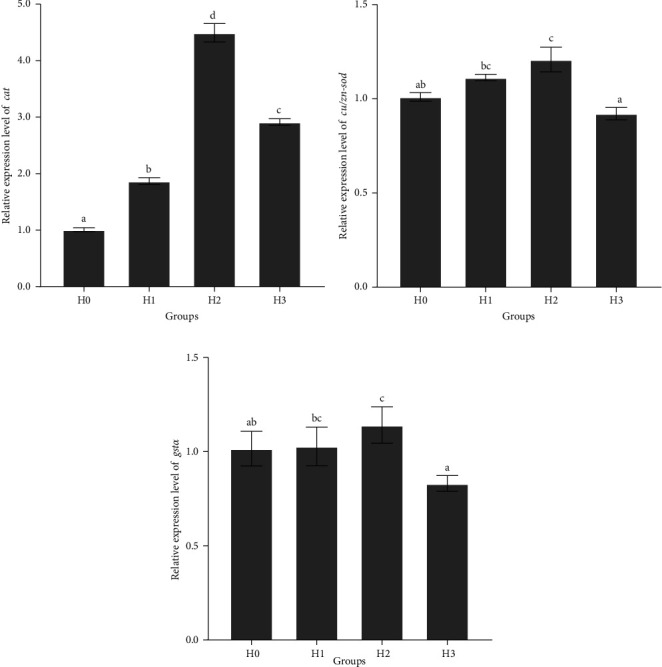
The relative expression of cat (A), cu/zn-sod (B), and gstα (C) in the hepatopancreas of juvenile M. armatus. cat, catalase; cu/zn-sod, cu/zn-superoxide dismutase; gstα, glutathione S-transferases α. H0, basal diet; H1, basal diet + 0.05% hydrolyzable tannin; H2, basal diet + 0.1% hydrolyzable tannin; H3, basal diet + 0.2% hydrolyzable tannin. The letters in the results indicate the outcomes of multiple-range tests. The different letters indicate significant differences (p < 0.05), while the same letter indicates no significant differences (p > 0.05).