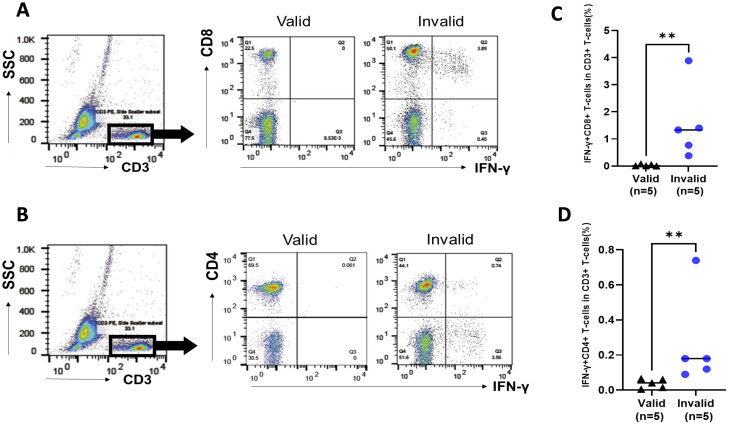
Figure 3.
Analysis of IFN-γ-producing cells in peripheral blood mononuclear cells (PBMCs) in participants with rheumatic disease (RD) who demonstrated valid and invalid T-SPOT.TB® results. PBMCs were obtained from participants with RD cultured without stimulation. PBMCs were collected after 24 h, and the population of IFN-γ-producing cells was analyzed using flow cytometry. (A) Representative data of CD8 versus IFN-γ plot of CD3+ T-cell population in participants with RD who exhibited valid or invalid T-SPOT.TB® assay results. (B) Representative data of CD4 versus IFN-γ plot of CD3+ T-cell population in participants with RD who demonstrated valid or invalid T-SPOT.TB® assay results. (C) Population of IFN-γ-producing CD8+ T cells and (D) IFN-γ-producing CD4+ T cells in participants with RD who showed valid (n = 5) or invalid (n = 5) T-SPOT.TB® assay results. The bold horizontal line indicates the median values. **P < 0.01 by Mann–Whitney U test.

