An official website of the United States government
Here's how you know
Official websites use .gov
A
.gov website belongs to an official
government organization in the United States.
Secure .gov websites use HTTPS
A lock (
) or https:// means you've safely
connected to the .gov website. Share sensitive
information only on official, secure websites.

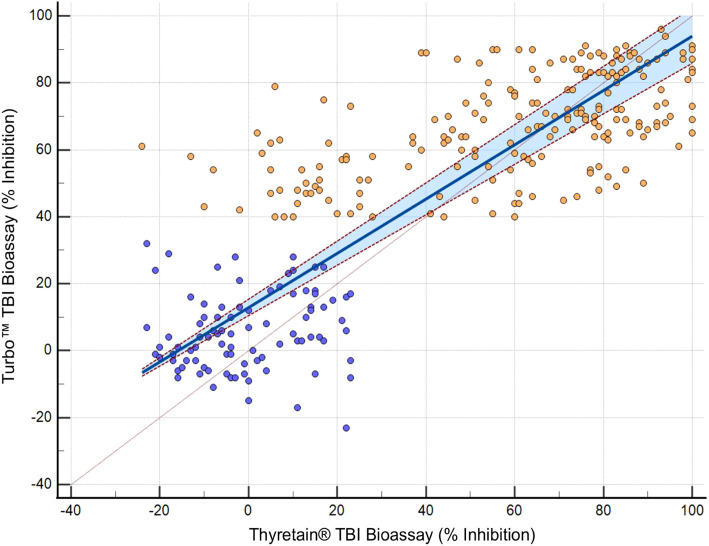
 , AITD;
  , control. Passing–Bablok regression of Turbo™ and Thyretain® TBI results. The blue area marks a 95% confidence interval. N = 302 (221 subjects). Spearman’s Rho, 0.8; 95% CI, 0.75–0.84; p< 0.001. y = 12.878378 + 0.810811x.