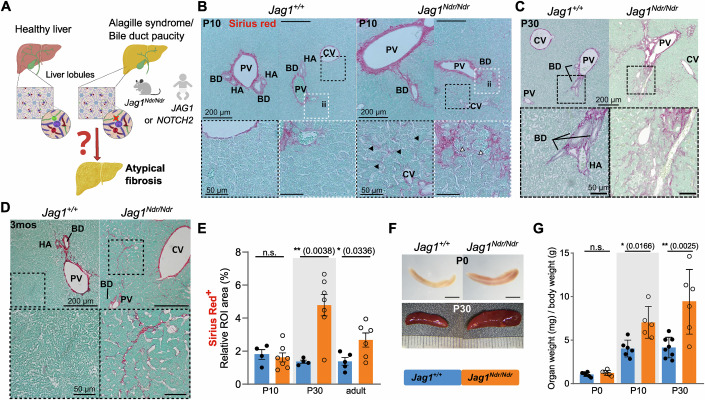
Figure 1. Jag1Ndr/Ndr mice display pericellular fibrosis and signs of portal hypertension.
(A) Schematic of healthy liver architecture and liver architecture with bile duct paucity in patients with ALGS or in Jag1Ndr/Ndr mice. Bile duct paucity results in cholestasis and liver disease, which in ALGS results in atypical fibrosis by unknown mechanisms and associated portal hypertension. (B–D) H&E and Sirius red staining at P10 (B), P30 (C) and 3 months (D) in Jag1+/+ and JagNdr/Ndr livers, with boxed regions magnified. Black arrowheads indicate pericellular and perisinusoidal fibrosis, white arrowheads indicate immune infiltration. (E) Quantification of the Sirius Red+ at P10, P30 and 3 months in Jag1+/+ and JagNdr/Ndr LLL liver sections. (F, G) Images (F) and weights (G) of spleens from Jag1+/+ and JagNdr/Ndr mice at the indicated ages. The scalebar in (F) is 1 mm for P0, and at P30 a ruler indicates 1 mm increments. (Each data point represents a biological replicate). Mean ± SD, Unpaired, two-tailed Student’s t-test, *p ≤ 0.05, **p ≤ 0.01, n.s. not significant. For (B–D), scalebar lengths are specified within each panel, and are identical within panels. LLL left lateral lobe, mos months, ROI region of interest, BD bile duct, PV portal vein, CV central vein, HA hepatic artery, ii immune infiltrate.

