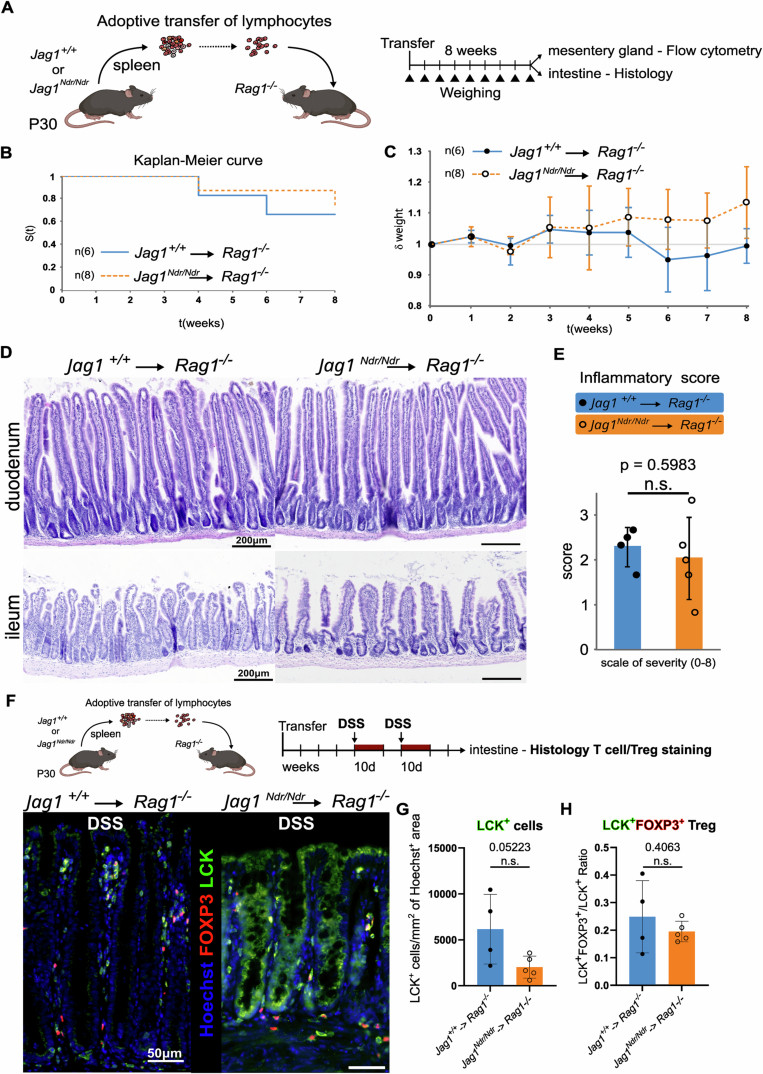
Figure EV4. Jag1Ndr/Ndr T cells are not autoimmune as shown by the transfer to Rag1−/− hosts.
(A) Schematic of the experiment. (B) Survival curve of the Rag1−/− animals over the course of 8 weeks following transfer with Jag1+/+ (n = 6) or Jag1Ndr/Ndr (n = 8) T cells. (C) Relative quantification of Jag1+/+→Rag1−/− and Jag1Ndr/Ndr→Rag1−/− mouse weight normalized to its original value on day 0 after T cell transfer over 8 weeks (1 = 100% of original weight, mean ± SD, n = 6–10 mice). (D) Representative H&E staining of intestinal sections (duodenum—top, ileum—bottom) performed 8 weeks after T cell transfer. (E) Comparison of the intestinal inflammatory score calculated using the H&E-stained slides of intestinal sections from the Jag1+/+→Rag1−/− (n = 4) and Jag1Ndr/Ndr→Rag1−/− (n = 5) mice. (F–H) Representative immunofluorescent images of sections from Jag1+/+→Rag1−/− (left) and Jag1Ndr/Ndr→Rag1−/− (right) mice intestine after DSS, stained for LCK and FOXP3, counterstained with Hoechst (F). Quantification of average LCK+ T cell count/Hoechst area (G), and LCK+/FOXP3+ Treg/LCK+ ratio (H) Means ± SD, Statistical analysis was performed by unpaired, two-tailed Student’s t-test.

