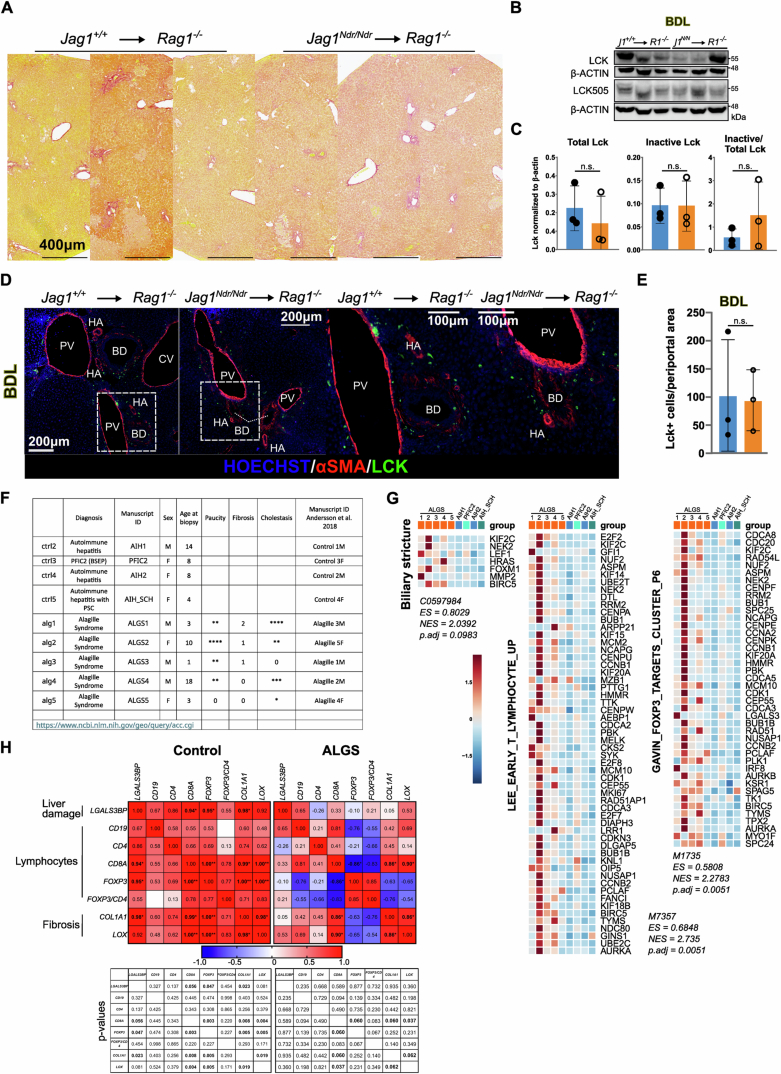
Figure EV5. T cells, present in the periportal area after bile duct ligation of Jag1Ndr/Ndr transplanted mice, are enriched in patients with ALGS and anti-correlate with fibrosis.
(A) Representative Sirius red staining in Zone 3 of Jag1+/+→Rag1−/− and Jag1Ndr/Ndr→Rag1−/− mice after BDL. (B, C) Western blot of total LCK, inactive Tyr505 LCK and β-ACTIN levels in LLL lysates from Jag1+/+→Rag1−/− and Jag1Ndr/Ndr→Rag1−/− mice (n = 3 each) after BDL (B) and respective quantification (C). Graph represents mean ± SD. (D, E) Representative immunofluorescent images of cryosections from the left lateral lobe of Jag1+/+→Rag1−/− (left) and Jag1Ndr/Ndr→Rag1−/− (right) mice after BDL treatment, stained with antibodies against Lck and SMA (D), and respective quantification of Lck+ in the periportal area (E), (n = 3 each). Graph represents mean ± SD, Statistical analysis was performed by unpaired, two-tailed Student’s t-test. (F) List of patient samples from Andersson et al, 2018, re-analyzed in this study. Asterisk indicates severity not significance. (G) Heatmap of gene sets over- and under-represented in ALGS and control patients. Significance was confirmed via false-discovery rate (FDR) statistic with 25% cutoff. (H) Pearson correlation of liver damage marker LGALS3BP, markers of lymphocytes CD19, CD4, CD8A, FOXP3 and markers of fibrosis COL1A1, LOX mRNA expression in patients with ALGS and control patients (p values *≤0.06; **≤0.005, are indicated below the heatmap). CV central vein, PV portal vein, BD bile duct, HA hepatic artery, AIH autoimmune hepatitis, SCH sclerosing cholangitis, PFIC2 Progressive familial intrahepatic cholestasis type 2, (N)ES (normalized) enrichment score. Fisher Exact test was used for the gene set enrichment analysis; LLL left lateral lobe, CV central vein, PV portal vein, BD bile duct, HA hepatic artery.

