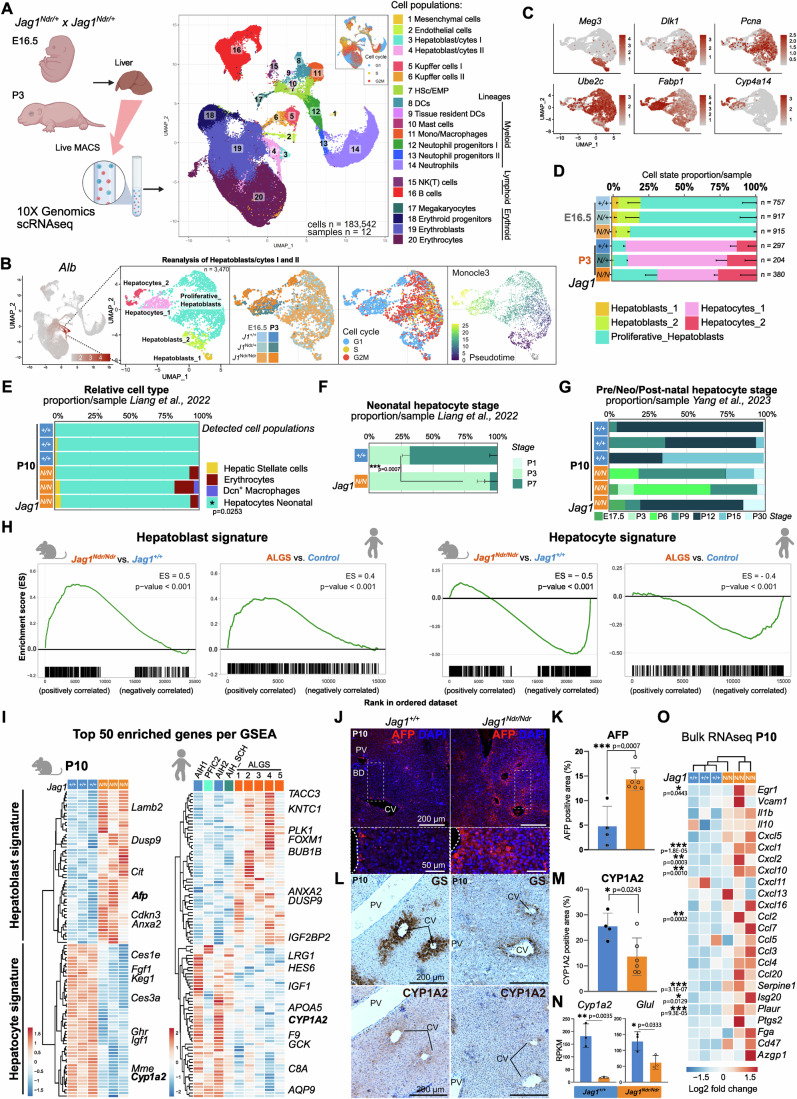
Figure 2. Hepatocytes are less mature in neonatal liver of Jag1Ndr/Ndr mice and patients with ALGS.
(A) Livers were collected at E16.5 or P3 and single-cell suspensions were analyzed by 10xGenomics scRNA sequencing. UMAP projection of 183,542 sequenced cells in cell type-annotated clusters, and cell cycle phase. (B) UMAP of the Hepatoblast/cytes I and II subset, reflecting their subclusters, genotypes, developmental stage, cell cycle status, and differentiation trajectory. (C) Feature plots with hepatoblast (Meg3, Dlk1), proliferation (Pcna, Ube2c), and hepatocyte (Fabp1, Cyp4a14) marker mRNA expression. (D) Average proportion of hepatic cell types per stage and genotype, for data in (B, C). (E–G) MuSiC deconvolution of P10 JagNdr/Ndr and Jag1+/+ whole liver bulk RNA seq using scRNAseq reference datasets (E), and stage-specific hepatocyte expression profile (F, G). (H) GSEA for hepatoblast and hepatocyte signatures in Jag1Ndr/Ndr vs Jag1+/+ mice (left of each subpanel) or in patients with ALGS vs other liver diseases (right of each subpanel). Enrichment score (ES) reflects the degree to which a gene set is overrepresented at the top or bottom of a ranked list of genes. p-value was calculated using gene set permutation test (1000 permutations), p-value < 0.001 indicates the actual p-value of less than 1/(number of permutations), see methods for further details. (I) Heatmap of top 50 enriched genes from each GSEA in (H) for mouse (left) and human (right) liver. (J, K) Staining for AFP and DAPI at P10 in Jag1+/+ (n = 4) and Jag1Ndr/Ndr (n = 7) livers (J), with quantification (K). Scalebar lengths are specified within the panel and are identical for Jag1+/+ and Jag1Ndr/Ndr mice. (L–N) Staining for GS and CYP1A2, with H&E counterstain (L), in consecutive sections at P10 in Jag1+/+ (n = 4) and Jag1Ndr/Ndr (n = 6) livers, with quantification of CYP1A2 protein (M), and P10 whole liver Cyp1a2 and Glu1 mRNA expression (n = 3 each) (N). Scalebar lengths in (L) are specified within the panel and are identical for Jag1+/+ and Jag1Ndr/Ndr mice. (O) Heatmap of Egr1-induced pro-inflammatory genes expressed by hepatocytes in Jag1Ndr/Ndr and Jag1+/+ mice at P10. HSc Hematopoietic Stem cells, EMP erythroid-myeloid progenitors, DCs dendritic cells, NK natural killer, AIH autoimmune hepatitis, PFIC2 progressive familial intrahepatic cholestasis type 2, SCH sclerosing cholangitis (mean ± SD; (E) was analyzed with 2-way ANOVA with Sidak multiple comparison). Interaction between cell type proportion and genotype is significant with p-value = 0.0139, graph indicates p-value of the multiple comparison. Data in (F), (K), (M), and (N) were analyzed by unpaired, two-tailed Student’s t-test, *p < 0.05, **p < 0.01, ***p < 0.001, in (O) was significance confirmed via Benjamini–Hochberg P value correction (Log2 FC > 0.5).

