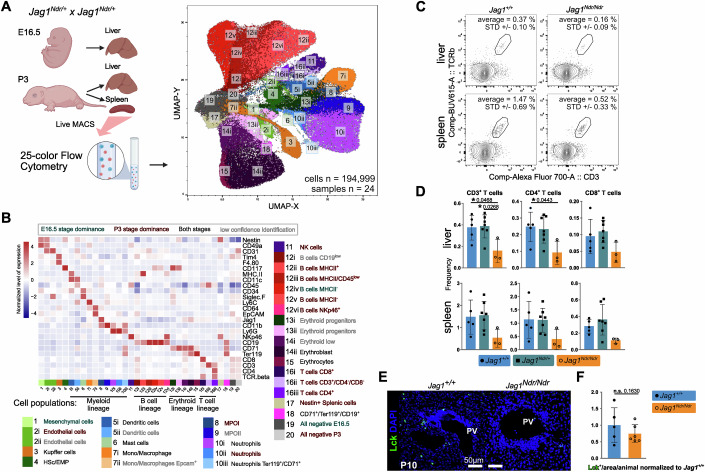
Figure 3. Flow cytometry analyses reveal a reduction of T cells in Jag1Ndr/Ndr liver.
(A) UMAP projection of 194,999 randomly selected sub-sampled cells from E16.5 and P3 liver and P3 spleens, analyzed by 25-color flow cytometry, with cell type-annotated clusters, matched to (Fig. 2A) insofar as possible. (B) Heatmap showing a row z-score of median protein expression levels of cell type markers in the aggregated 25-color flow cytometry dataset from E16.5 and P3 livers, and P3 spleens of Jag1+/+ (n = 7), Jag1Ndr/+ (n = 11), and Jag1Ndr/Ndr (n = 6) animals. (C, D) Representative flow cytometry plots (C) and relative frequency of the CD3+, CD4+/CD3+, and CD8+/CD3+ T cells in livers and spleens from the Jag1+/+, Jag1+/Ndr and Jag1Ndr/Ndr mice at P3 (D). (E, F) Representative immunofluorescent staining (E) and quantification (F) of LCK+ T cells in periportal areas in Jag1Ndr/Ndr and Jag1+/+ livers at P10 (n = 5 Jag1+/+, and 6 JagNdr/Ndr animals). PV, portal vein. Scalebar lengths in (E) are specified within the panel and are identical for Jag1+/+ and Jag1Ndr/Ndr mice. HSc hematopoietic stem cells, EMP erythroid-myeloid progenitors, MPO myeloid progenitors, NK natural killer. All graphs represent mean ± SD. Statistical test in (D) is one-way ANOVA with Dunnett’s multiple comparison test, (Jag1+/+ vs. Jag1Ndr/Ndr) Jag1+/Ndr and Jag1Ndr/Ndr, and in (F) is an unpaired, two-tailed Student’s t-test, *p < 0.01); Each data point represents a biological replicate.

