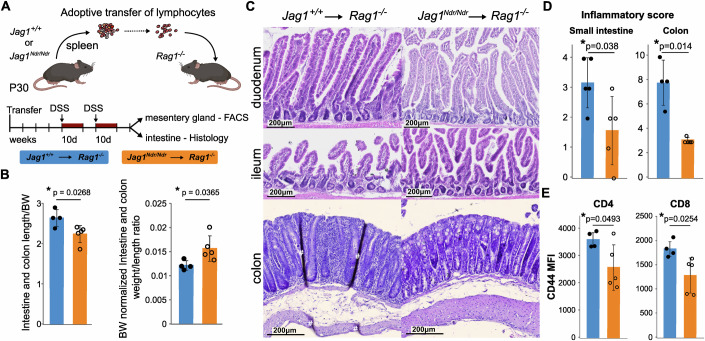
Figure 5. Jag1Ndr/Ndr T cells do not mount an adequate response to DSS-induced colitis.
(A) Scheme of the Dextran sodium sulfate (DSS)-induced colitis. (B) Length, and weight/length ratios of the intestines and colons from DSS-treated Jag1+/+→ Rag1−/− (n = 4) and Jag1Ndr/Ndr→Rag1−/− (n = 5) mice, normalized to body weight. (C, D) Representative H&E-stained intestinal (top), and colonic (bottom) sections from Rag1−/− mice transplanted with Jag1+/+ or Jag1Ndr/Ndr T cells, upon DSS treatment (C), and their inflammatory scores (D). (E) Flow cytometry analysis of the mean fluorescence intensity (MFI) of CD44 staining of CD4+ and CD8+ T cells from DSS-treated Jag1+/+→Rag1−/− and Jag1Ndr/Ndr→Rag1−/− mesenteric lymph nodes. Each data point represents a biological replicate. mean ± SD, Unpaired, two-tailed Student’s t-test, *p ≤ 0.05. # - tissue folding artifact.

