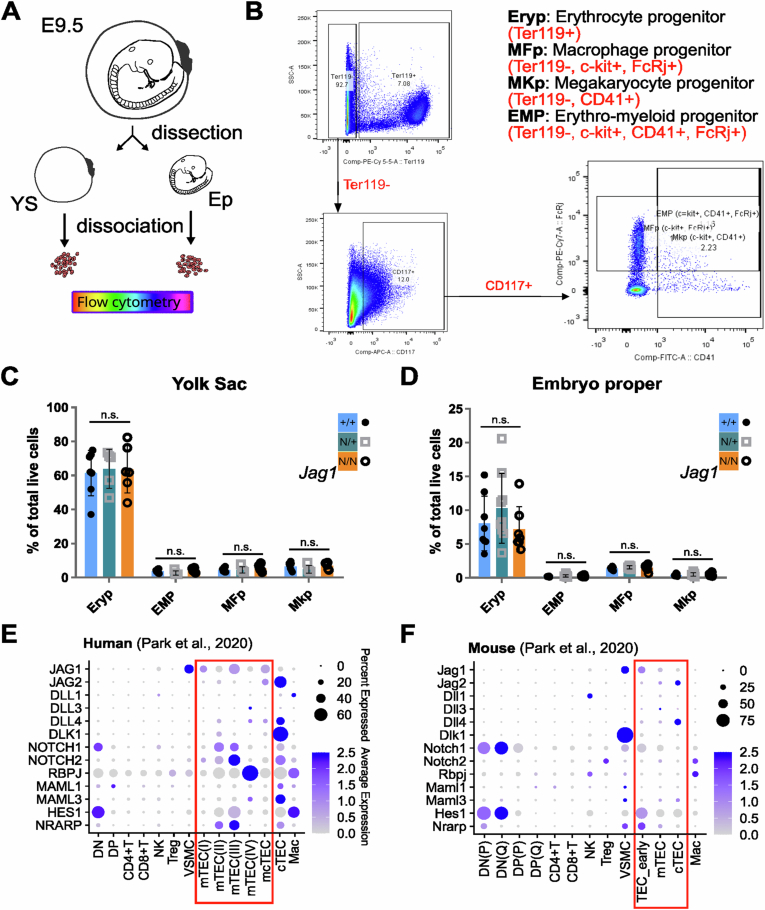
Figure EV3. The proportions of early embryonic hematopoietic progenitor populations are not altered in Jag1Ndr/Ndr embryo proper (EP) and yolk sac (YS).
(A) Schematic of the experiment. E9.5 embryos were harvested and yolk sac (YS) and embryo proper (EP) were processed separately for flow cytometry analysis. (B) Gating strategy for identification of the Erythrocyte progenitors (Eryp), Macrophage progenitors (MFp), Megakaryocyte progenitors (MKp), and Erythro-myeloid progenitors (EMP) after dead cell exclusion. (C, D) Relative proportion of live Eryp, EMP, MFp, and MKp cells from Jag1Ndr/Ndr (n = 7), Jag1Ndr/+ (n = 9), and Jag1+/+ (n = 8) yolk sac (C) and whole E9.5 embryos (D). Graph represents mean ± SD. (E, F) Dot plot of the re-analyzed median scaled ln-normalized mRNA expression of Notch signaling components in human (E) and mouse (F’) thymic cell populations from Park et al, 2020. One-way ANOVA, multiple comparison with Bonferroni method; n.s., no significant difference.

