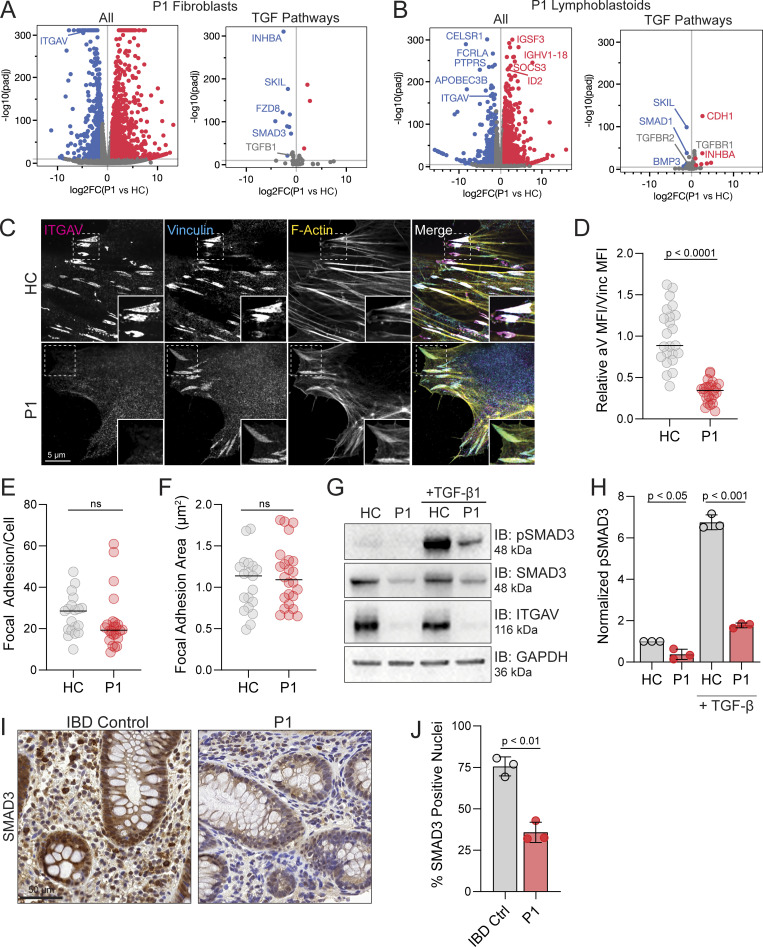
Figure 3.
ITGAV variants cause defects in TGF-β signaling and gene expression. (A) Volcano plot of differentially expressed genes between P1 and HC derived fibroblasts (n = 3, adjusted P value <1e−10, DESeq2 Wald) (left). A subset of genes related to TGF-β signaling obtained from Harmonizome 3.0 (right). (B) Volcano plot of overall differentially expressed genes between P1 and a HC derived lymphoblastoid cell line (n = 3 replicates per sample, adjusted P value <1e−10, DESeq2 Wald test) (left). P1 lymphoblasts show loss of ITGAV transcript and upregulation of some immune regulatory genes. A subset of genes related to TGF-β signaling (right). (C–F) Fibroblasts from P1 or HC immunostained for Integrin αV (magenta) and vinculin (cyan) together with phalloidin (yellow) for F-Actin. In D–F, each dot represents a field of view (paired t test, P < 0.0001, ns, ns, n = 3). (G and H) Immunoblotting for pSMAD3 (Ser 423/425), SMAD3, and Integrin αV protein levels in fibroblasts derived from HC or P1 as indicated before and after 20 ng/ml mature TGF-β stimulation for 15 min (n = 3). GAPDH was used as a loading control. Values were normalized to HC (paired t test, P < 0.05, error bars, mean ± SEM). (I and J) Immunohistochemistry staining for SMAD3 in biopsies of the ascending colon obtained from an IBD control patient and P1. Slides were also stained with H&E. Sections were quantified using thresholding of signal in the nucleus by HALO. Three independent sections of the same gut were analyzed (paired t test, P < 0.01, n = 3). Source data are available for this figure: SourceData F3.

