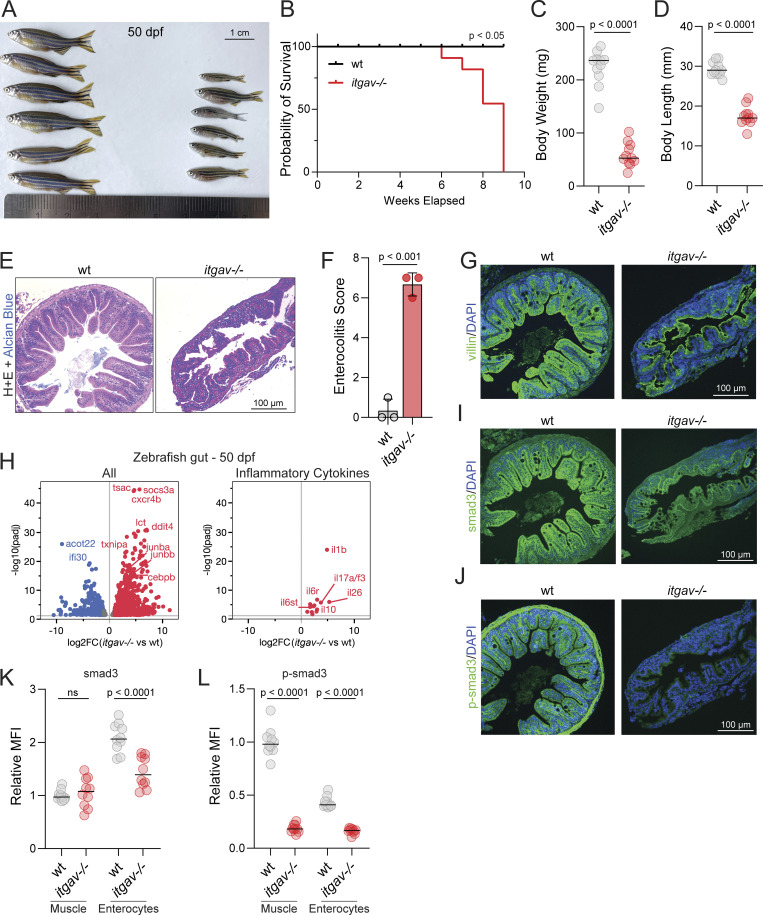
Figure 5.
Zebrafish: Late colitis phenotype. (A) Representative image of wild-type (wt) and itgav−/− zebrafish at 50 dpf. (B) Kaplan–Meier survival curve of zebrafish wt and itgav−/− (n = 20, log-rank Mantel–Cox test, P < 0.05) (C and D) Measurements of body weight (C) and body length (D) (n = 12, unpaired t test, P < 0.0001). (E) Representative images of H&E staining of cross sections corresponding to the mid-intestine of zebrafish at 50 dpf (n = 3). (F) Total enterocolitis score of the gut for zebrafish wt and itgav−/− (n = 3, unpaired t test, P < 0.001). (G) Representative images of villin1 (green) and DAPI (nuclei, blue) imaged with immunofluorescence in the mid-intestine of wt and itgav−/− zebrafish at 50 dpf (n = 3). (H) Volcano plot of RNA-sequencing data showing differential gene expression between 50 dpf itgav−/− versus wt fish dissected gut tissue, annotated on GRCz11 (left). Subset of differentially expressed inflammatory cytokine genes in the gut at 50 dpf (right) (n = 3, adjusted P value 0.01, DESeq2 Wald). (I and J) Representative images of total smad3 and p-smad3 (green) and DAPI (nuclei, blue) imaged with immunofluorescence in the mid-intestine of wt and itgav−/− zebrafish at 50 dpf (n = 3). (K and L) Quantification of total smad3 and p-smad3 in the muscle layer and enterocytes for the mid-intestine of wt and itgav−/− zebrafish at 50 dpf (10 intestinal folds from unpaired t test, n = 3 for each group).

