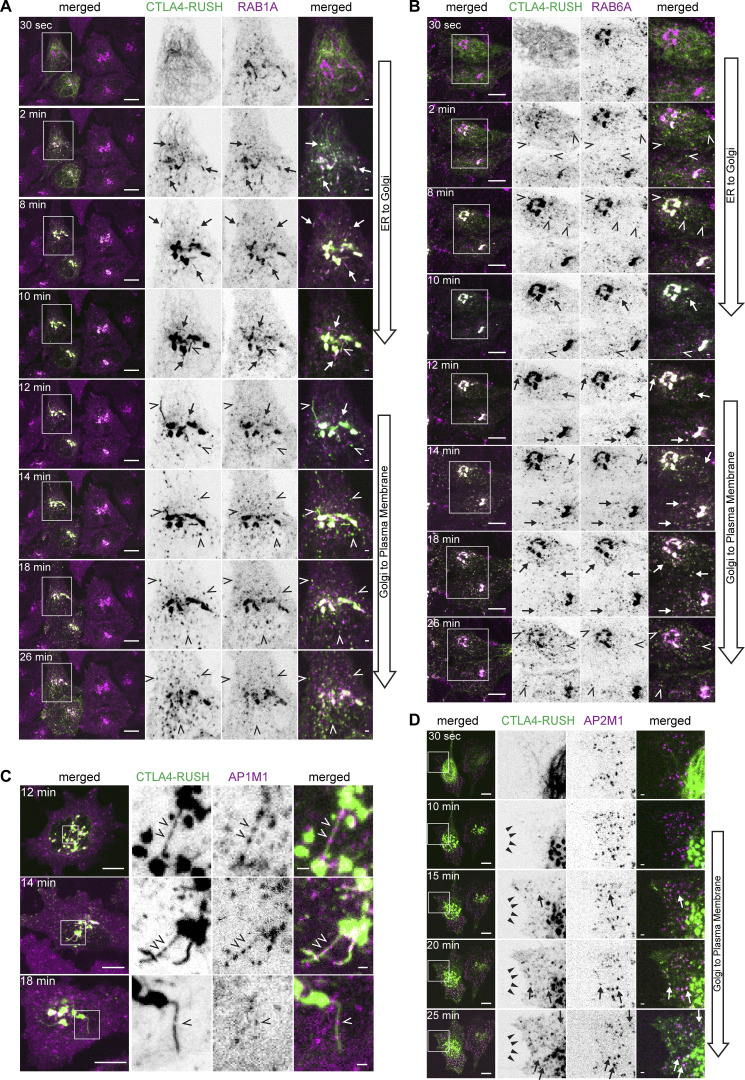
Figure S3.
Characterization of intracellular trafficking of CTLA4-EGFP-RUSH protein. (A) Live cell imaging of HeLa cells stably transfected with mScarlet-RAB1A and transiently transfected with CTLA4-EGFP-RUSH at the indicated time points after the addition of 50 µM biotin. Arrows and open arrowheads point to colocalization or lack of colocalization of CTLA4 with RAB1A, respectively. Scale bars 10 µm (left merged) or 1 µm (right merged). (B) Live cell imaging of HeLa cells stably transfected with mScarlet-RAB6A and transiently transfected with CTLA4-EGFP-RUSH at the indicated time points after the addition of 50 µM of biotin. Arrows and open arrowheads point to colocalization or lack of colocalization of CTLA4 with RAB6A, respectively. Scale bars 10 µm (left merged) or 1 µm (right merged). (C) Live cell imaging of HeLa cells stably transfected with AP1M1-mScarlet and transiently transfected with CTLA4-EGFP-RUSH at the indicated time points after the addition of 50 µM of biotin. CTLA4-RUSH is excluded from AP1M1-positive transport carriers forming along the secretory tubule (open arrowhead). Scale bars 10 µm (left merged) or 1 µm (right merged). (D) Live cell imaging of HeLa cells stably transfected with AP1M1-mScarlet and transiently transfected with CTLA4-EGFP-RUSH at the indicated time points after the addition of 50 µM of biotin. Arrows point to colocalization of CTLA4 and AP2M1. The cell edge (solid arrowhead) is labeled with CTLA4-RUSH starting from 15 min after initiation of CTLA4 trafficking. Scale bars 10 µm (left merged) or 1 µm (right merged).

