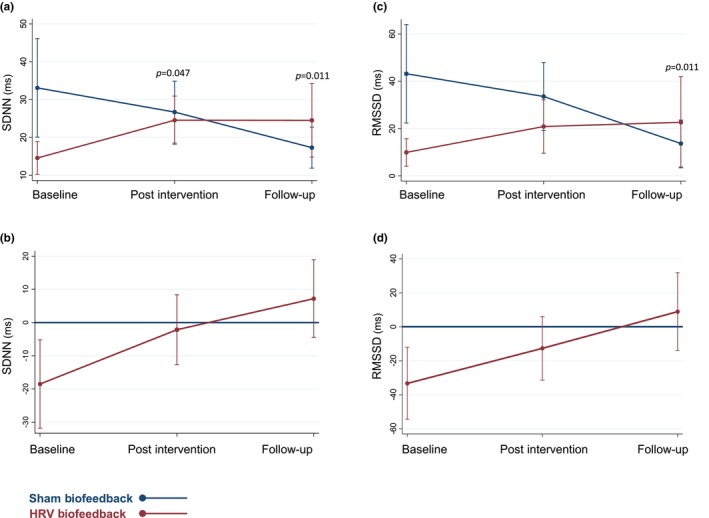
FIGURE 3.

Time domain analysis of heart rate variability (HRV) under normal breathing. Time domain parameters of HRV under normal breathing. Predictive margins plots of SDNN (a), and root mean square of successive RR interval differences (RMSSD) (c) showing linear predictions with fixed proportions with 95% confidence intervals. Contrast of predictive margins plots for standard deviation of normal‐to‐normal intervals (SDNN) (b), and RMSSD (d) with 95% confidence intervals. ms, milliseconds.
