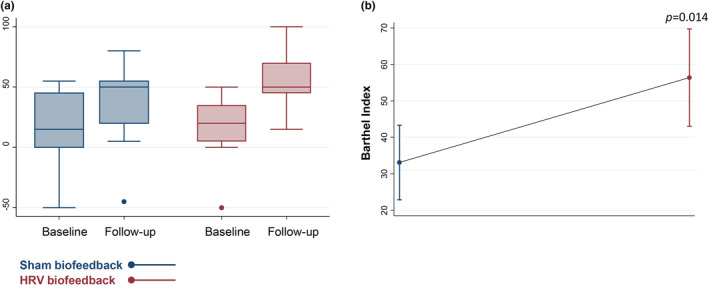
FIGURE 5.

Functional disability at time of follow‐up. (a) Box plot of Barthel index values at the time of follow‐up depicting medians and interquartile ranges. (b) Linear prediction plot of disability at follow‐up assessed via Barthel index depicting predictive margins with 95% confidence intervals. The p value refers to between‐group comparison (HRV biofeedback vs. sham biofeedback).
