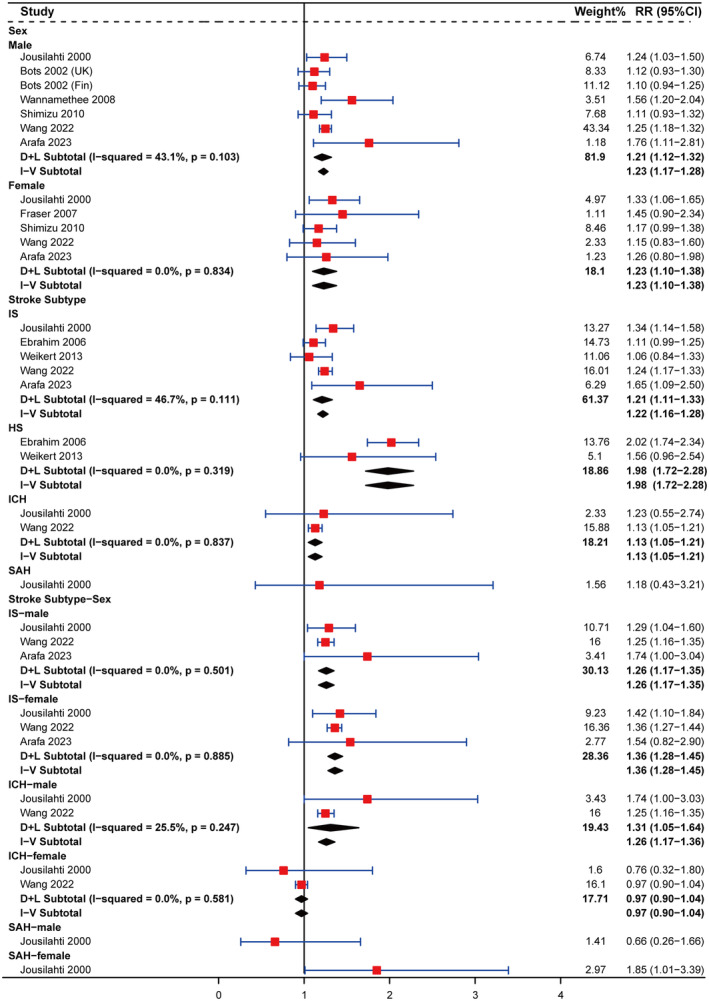
FIGURE 3.

Subgroup analyses on the associations of serum γ‐glutamyl transferase level with stroke stratified by sex, stroke subtype, and stroke subtype‐sex. Squares represent the estimate of relative risk for each study; the horizontal lines represent the 95% confidence interval (95% CI), and the diamonds represent the overall estimate and its 95% CI. CI, confidence interval; D + L, DerSimonian and Laird random effects model; GGT, γ‐glutamyl transferase; HS, hemorrhagic stroke; ICH, intracerebral hemorrhage; IS, ischemic stroke; I‐V, inverse variance fixed effects model; RR, relative risk; SAH, subarachnoid hemorrhage.
