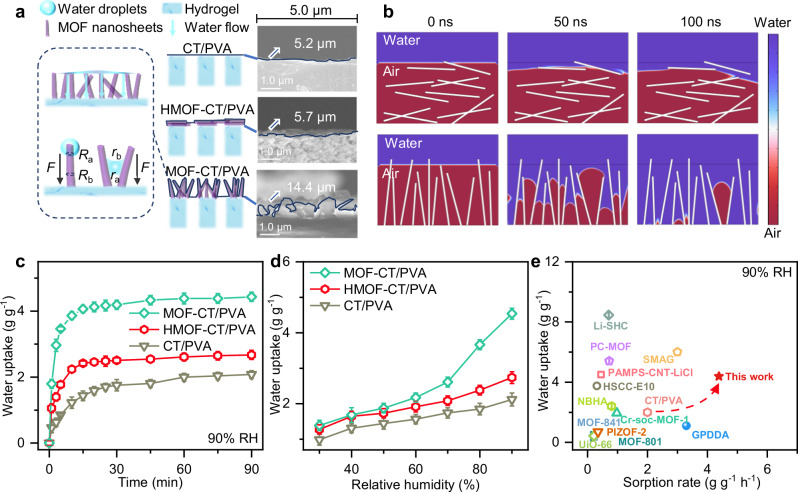
Fig. 3. AWH performance of MOF-CT/PVA and morphology effect on water transportation.
a Schematic of water droplets transport channels and sorbent-air interfaces of CT/PVA, HMOF-CT/PVA, and MOF-CT/PVA. The vertical alignment of MOF nanosheets enhances the water capture and transportation capabilities of MOF-CT/PVA (highlighted within dark blue dash frames). Ra and Rb are the local radii of the nanosheets. ra and rb represent the transverse radius at the two opposite menisci. F is the Laplace pressure difference. Inset: the sorbent-air interface edges were outlined by solid dark blue lines in the cross-sectional SEM images of CT/PVA, HMOF-CT/PVA, and MOF-CT/PVA. b Two-phase flow simulation of water transportation behavior on horizontally and vertically distributed structures of the MOF layer based on computational fluid dynamics. c The water vapor collection performance of CT/PVA, HMOF-CT/PVA, and MOF-CT/PVA at 90% RH. The error bars represent the standard deviation of data from three distinct samples (n = 3). d The water vapor collection performance of CT/PVA, HMOF-CT/PVA, and MOF-CT/PVA at different RH. The error bars represent the standard deviation of data from three distinct samples (n = 3). e Comparison of water uptake (g g−1) and sorption rate (g g−1 h−1) for AWH between MOF-CT/PVA and sorbents reported in the literature. The AWH performance data are shown in Supplementary Table 4.

