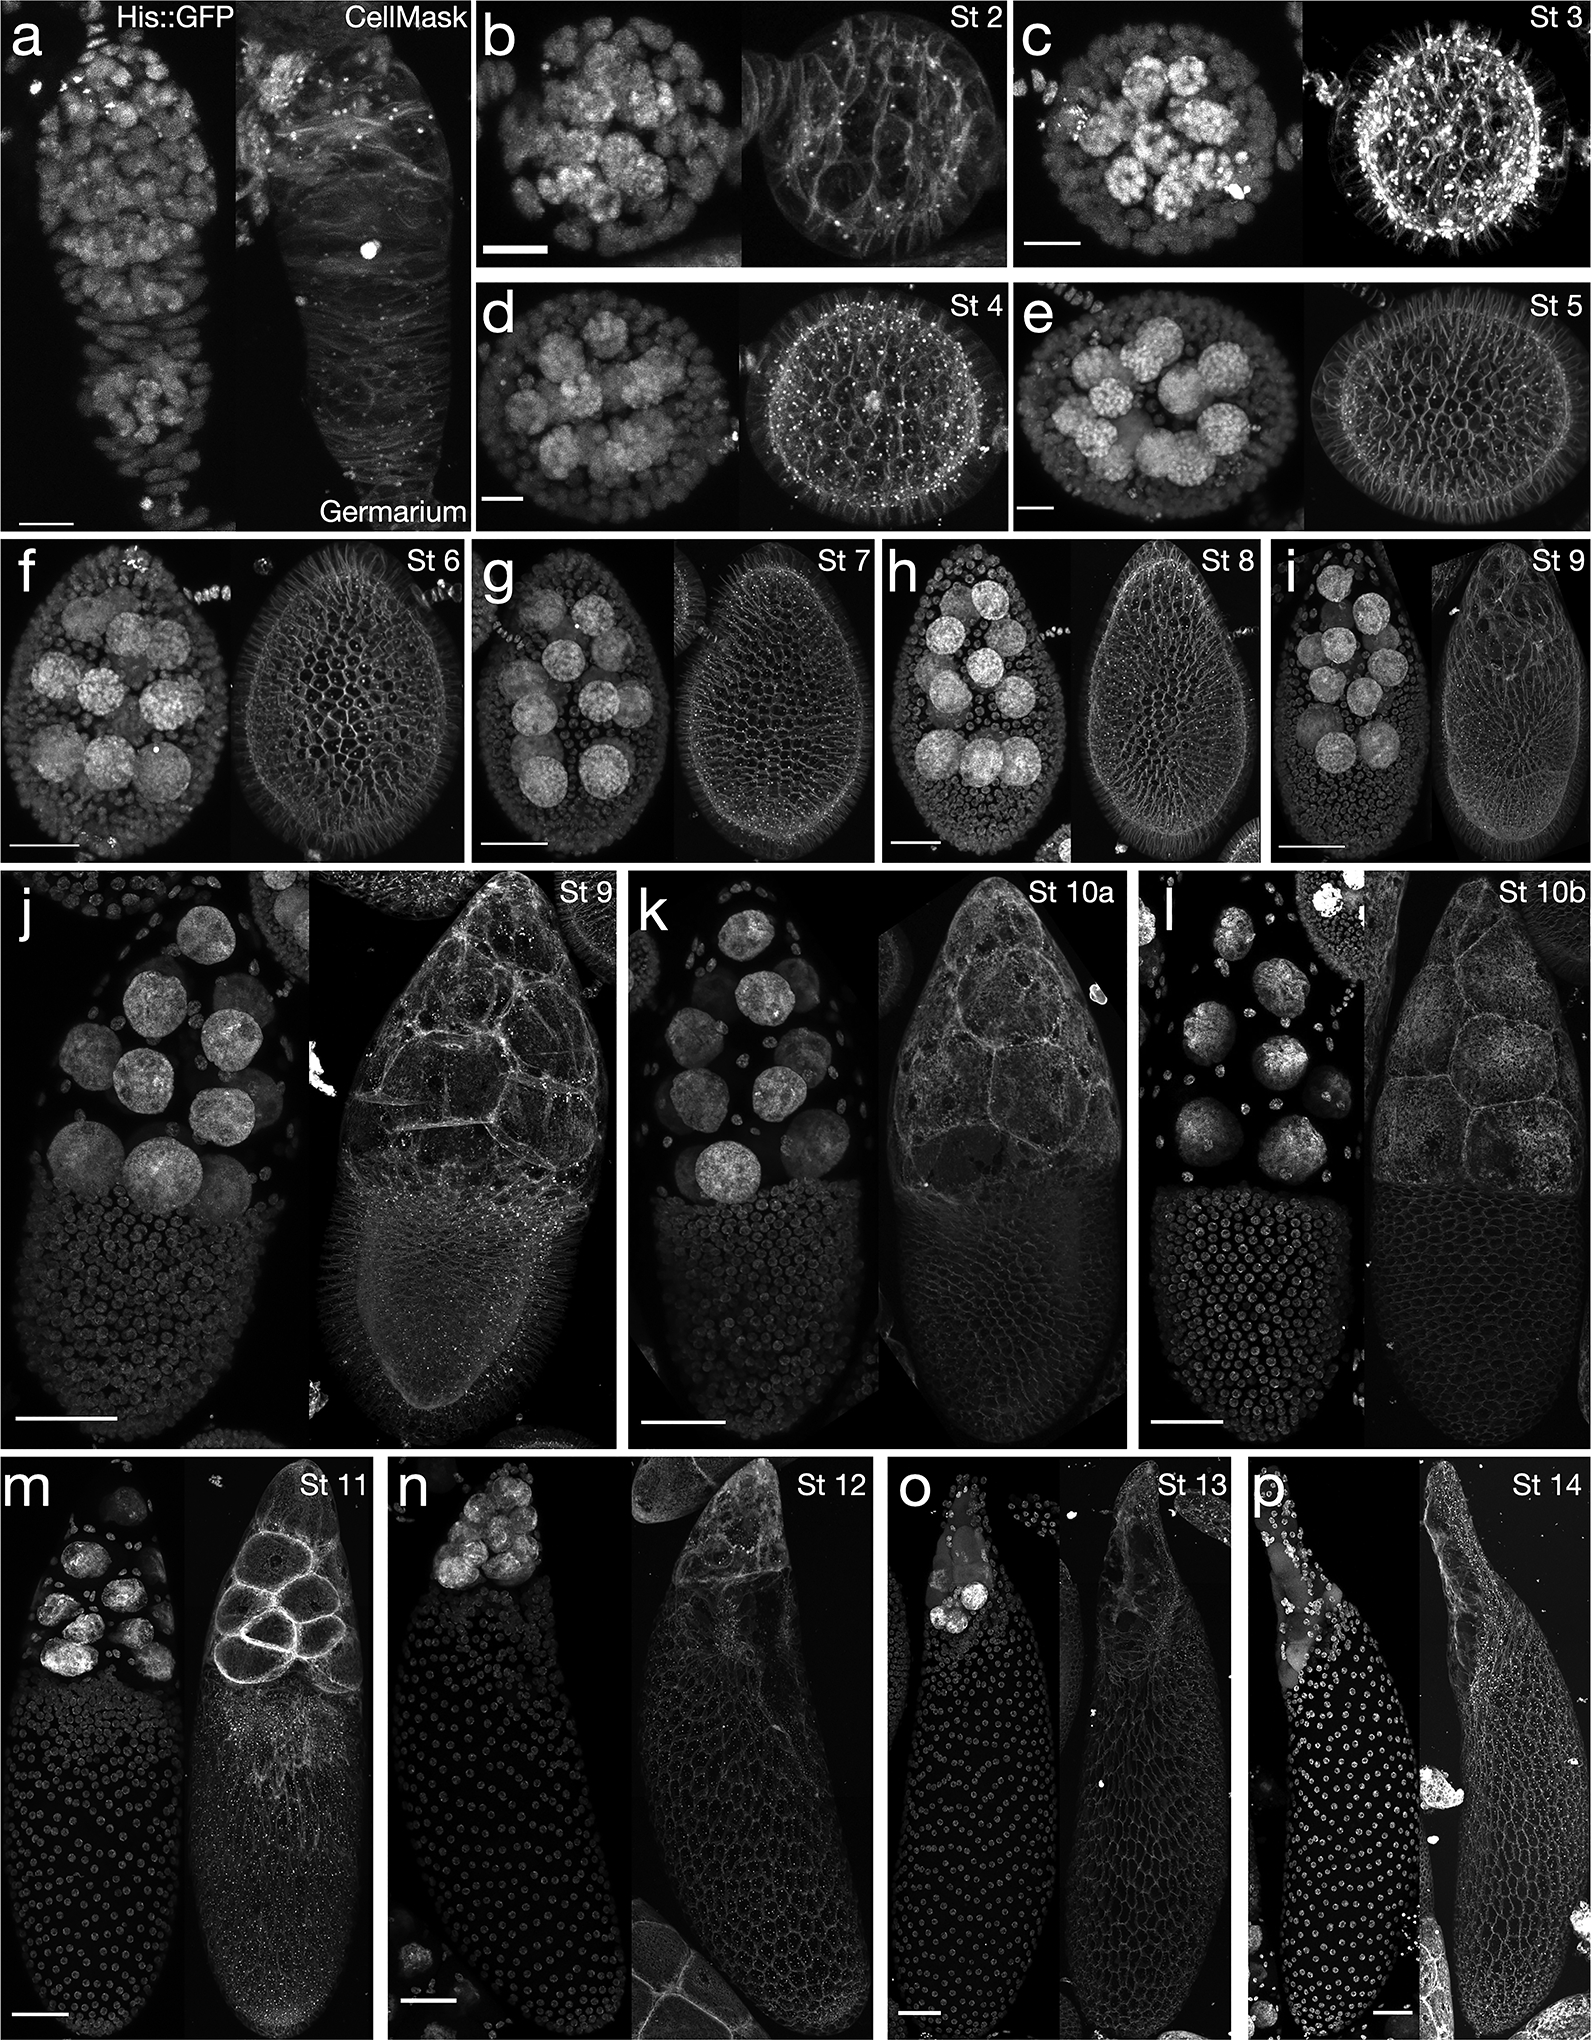
Figure 1: The 14 stages of Drosophila melanogaster oogenesis.

Histone H2A::GFP (left) and CellMask signal (right) for egg chambers from youngest to oldest, with stage (St) for each. A. germarium; B. stage 2; C. stage 3; D. stage 4; E. stage 5; F. stage 6; G. stage 7; H. stage 8; I. early stage 9, just prior to border cell migration; J. later in stage 9, when the border cells are partway to the oocyte; K. stage 10a; L. stage 10b; M. stage 11, relatively early into the nurse cell dumping process; N. stage 12, roughly at the end of nurse cell dumping; O. stage 13; P. stage 14. Note: inhomogeneity in follicle cell layer CellMask signal in M,N is partly a result of uneven staining where the egg chamber was in contact with the glass dish (slight spatial discontinuities in M-P result from imperfect merging of tile scans). Scale bars: 10 μm (A-E), 20 μm (F), 30 μm (G,H), 50 μm (I-P). Stages are determined from a combination of egg chamber dimensions, nuclear size, and other morphological considerations detailed previously [4,23]. Anterior is at the top in all panels except B-E, in which anterior is to the left. Other objects in the corners of images are portions of nearby egg chambers that are partly in the field of view.
