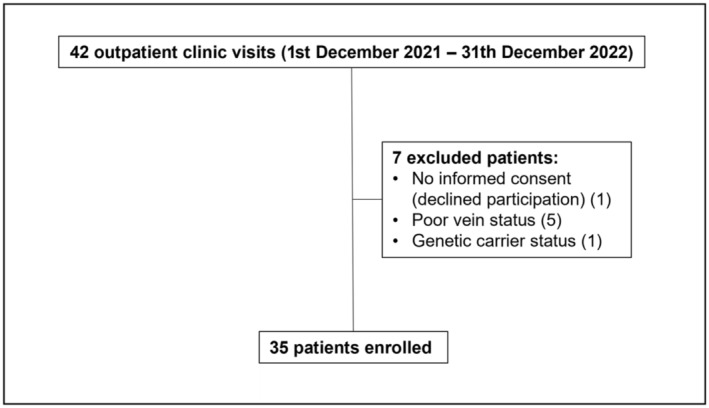
FIGURE 1.

Flowchart for included and excluded patients. Flowchart depicts the process of patient inclusion and exclusion throughout the study. The chart details the total number of patients enrolled, as well as those excluded, with reasons for exclusion provided.
