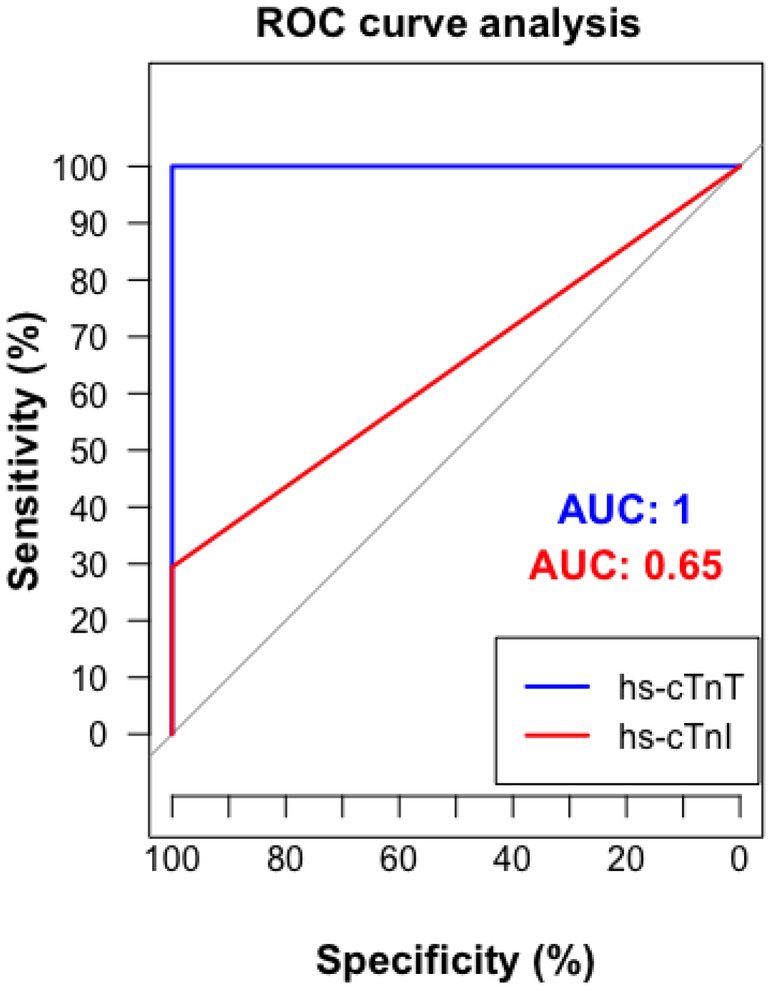
FIGURE 3.

Diagnostic performance of high‐sensitivity cardiac troponin T (hs‐cTnT) and high‐sensitivity cardiac troponin I (hs‐cTnI): receiver operating characteristic (ROC) curve analysis for cardiac involvement. The curve demonstrates sensitivity versus specificity for each biomarker to detect cardiac involvement. The area under the curve (AUC) values are included to quantify the diagnostic accuracy of hs‐cTnT and hs‐cTnI.
