FIGURE 6.

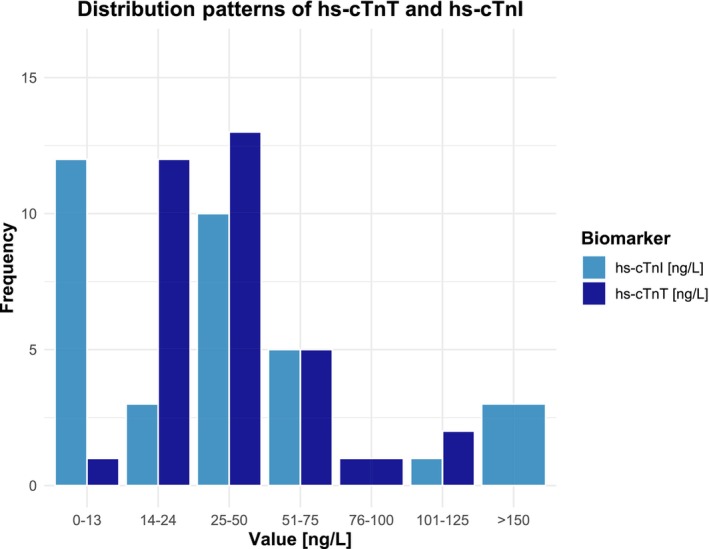
Comparative distribution of high‐sensitivity cardiac troponin T (hs‐cTnT) and high‐sensitivity cardiac troponin I (hs‐cTnI) levels in patients with cardiac involvement.

Comparative distribution of high‐sensitivity cardiac troponin T (hs‐cTnT) and high‐sensitivity cardiac troponin I (hs‐cTnI) levels in patients with cardiac involvement.