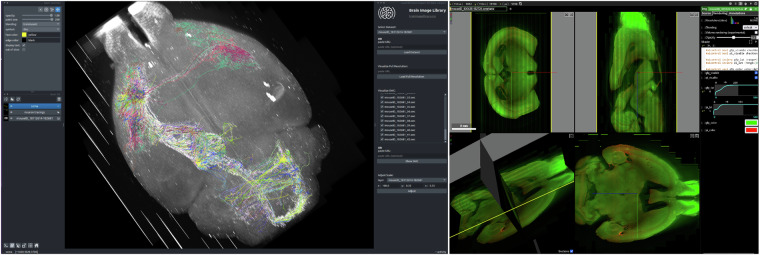
Fig. 3.
Visualization of BIL data. The bil-data-viewer plugin for napari (left) displays a 3D view of a fMOST dataset with overlaid neuron morphologies rendered from the SWC files which are shown along with the plugin interface. Neuroglancer visualizations (right) are available for many BIL datasests. A link to the neuroglancer example shown here is available at the following search url and is generated from the dataset located at 10.35077/ace-bag-kit. The neuron morphology dataset shown in this example is available at 10.35077/web, and the fMOST images are available at 10.35077/ace-ban-ear. These images were generated to illustrate the capabilities of the napari-bil-data-viewer and BIL neuroglancer viewer. The image on the left can be reproduced by installing napari-bil-data-viewer (v0.5.1 and napari v0.4.18). Image acquisition tools and parameters can be found in corresponding metadata at BIL. The lookup tables were adjusted minimally, for the entire image.

