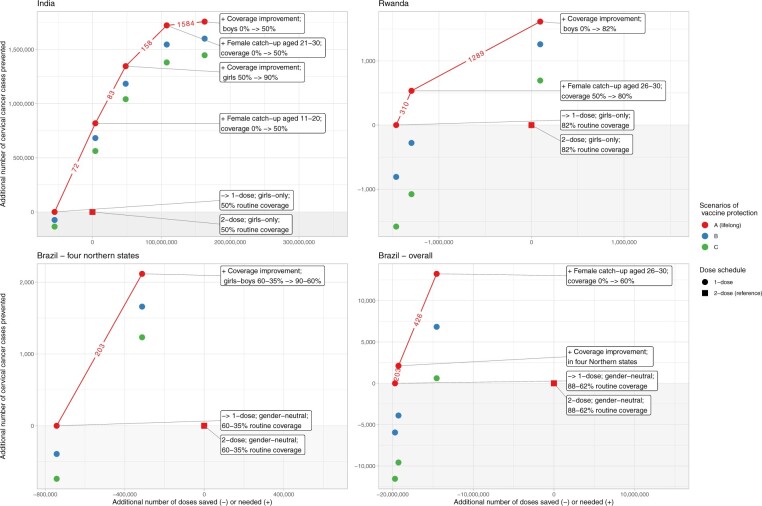
Figure 3.
Composite resource allocation strategy based on ranked dose efficiency. In panel Brazil – 4 northern states, we display the only 4 states throughout Brazil that are not expected to reach elimination under current coverage. Squares: reference of 2-dose routine vaccination without any reallocation strategy. Circles: scenarios of 1-dose routine vaccination under successive addition of reallocation strategies. Red-blue-green: vaccine protection scenarios A-B-C. Numbers on line segments: dose efficiency, in number of additional vaccine doses needed to prevent 1 cervical cancer. Grey area: area of insufficient resource reinvestment leading to a decrease in overall number of cervical cancer cases prevented as compared with 2-dose reference. -> = to.

