
Figure 2.
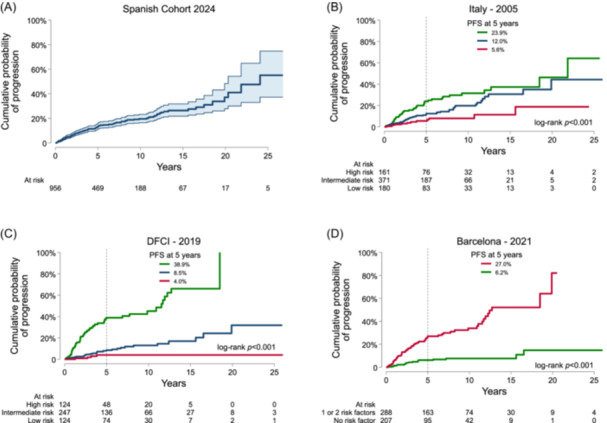
Progression‐free survival (PFS) in the Spanish multicenter registry and according to each prognostic risk model. Each plot reflects a Kaplan–Meier survival curve of the progression risk in the Spanish Cohort (A), the Italian group (B), the Dana Farber Cancer Institute (DFCI) group (C), and the Barcelona group (D).