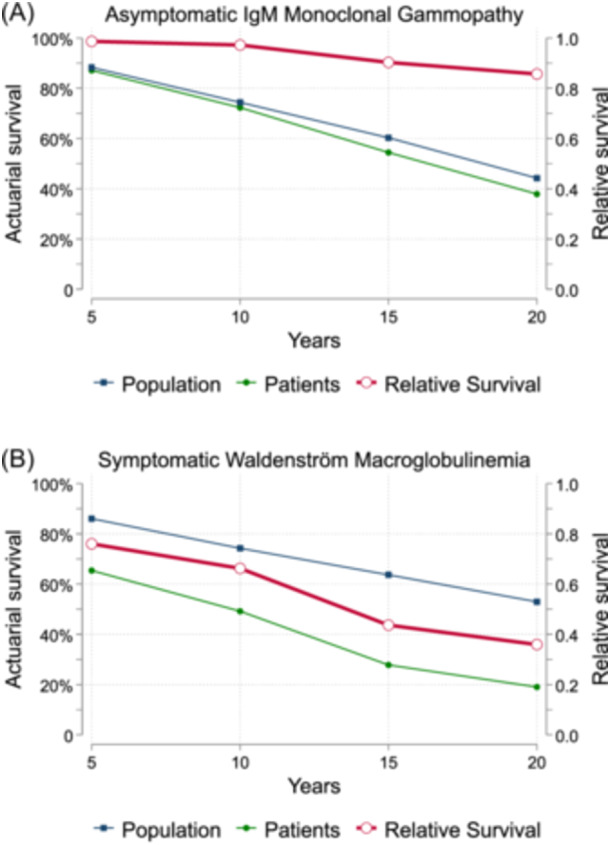
Figure 5.

Relative survival rates compared with the Spanish Health records from the Human Mortality Database. Each plot reflects the relative survival rate (in red), the Spanish population actuarial survival (in blue), and the patients' actuarial survival (in green) (A). Symptomatic Waldenström macroglobulinemia patients showed a survival curve below the Spanish population since diagnosis (B). CI, confidence interval.
