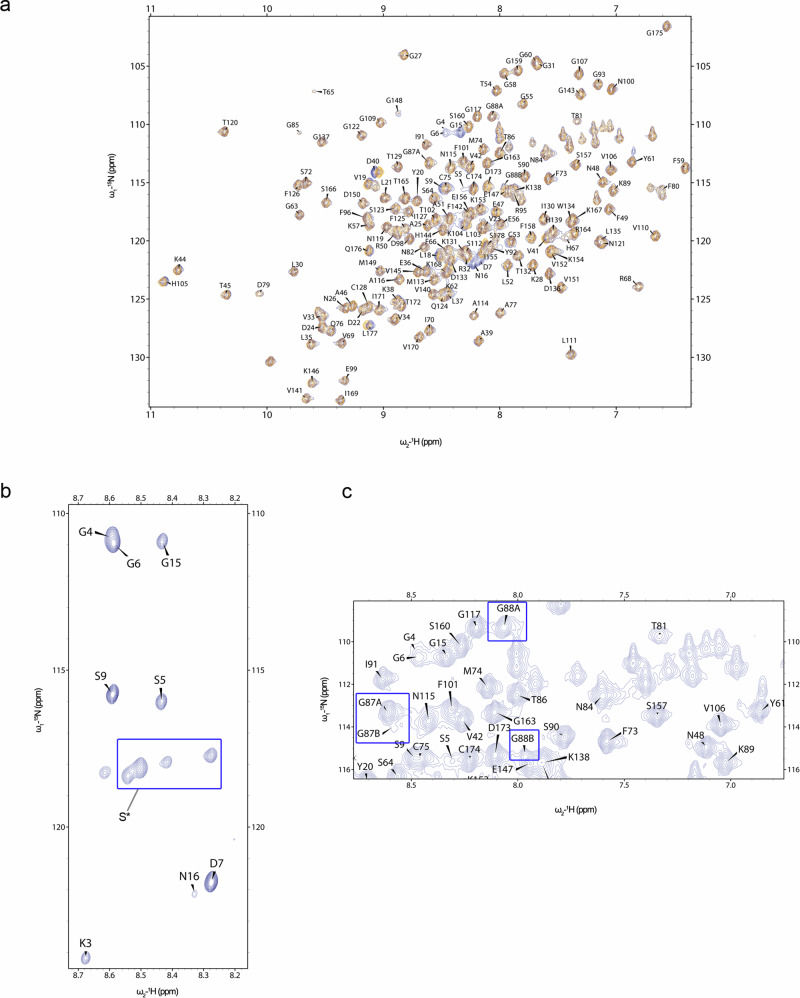
Fig. 2. NMR chemical shifts assignment of human FL-CyPD and ΔN-CyPD.
a Overlay of the 1H-15N HSQC spectra (protein fingerprints) of FL-CyPD (blue) and ΔN-CyPD (orange) acquired at 298 K. b 1H-15N HSQC spectrum of FL-CyPD at 283 K. Counter levels were reduced to show the higher intensity of the signals from the N-terminal tail compared to the other residues. c Representative image from the 1H-15N HSQC spectrum acquired at 298 K of FL-CyPD showing the double forms of G87 and G88. Samples consisted of 500 μM CyPD in 20 mM NaPi pH 7.0. Spectra were acquired in a 700 MHz Bruker Spectrometer.

