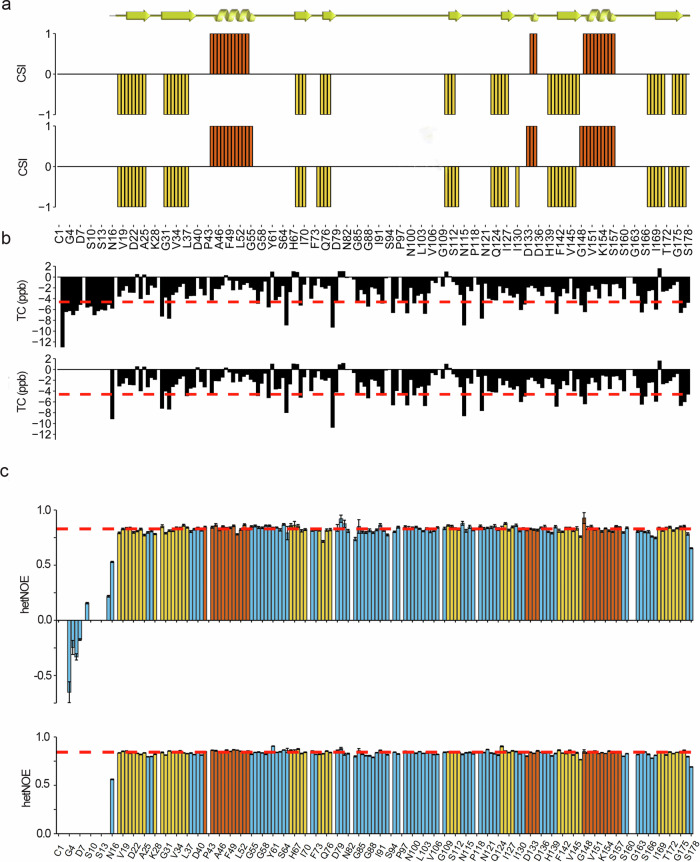
Fig. 3. Structural and dynamical features of human FL-CyPD and ΔN-CyPD.
a Secondary structure of human FL-CyPD (upper barplot) and ΔN-CyPD (lower barplot) derived from the assigned main chain NMR chemical shifts according to the chemical shift indexing performed by TALOS-N (+ 1=helix, red; −1=strand, yellow; 0=random coil). The comparison with the crystallographic secondary structure, graphically represented above (ribbon=helix, arrow=strand), is also shown. b Temperature coefficients for each main chain amide group from FL-CyPD (upper barplot) and ΔN-CyPD (lower barplot). The plot is aligned with the one presented in (a), so the x-axis (representing the primary sequence) is the same. Red dashed line represents the limit above which a given amide group is considered involved in a H-bond (−4.6 ppb). c Barplots representing the hetNOE for each residue within FL-CyPD (upper barplot) and ΔN-CyPD (lower barplot). Bars are coloured according to the crystallographic secondary structure (blue=random coil; red=helix; yellow=strand). The red dotted lines represent the mean hetNOE of the secondary structure elements (0.828 for FL-CyPD, 0.842 for ΔN-CyPD). Error bars have been defined in the methods section.

