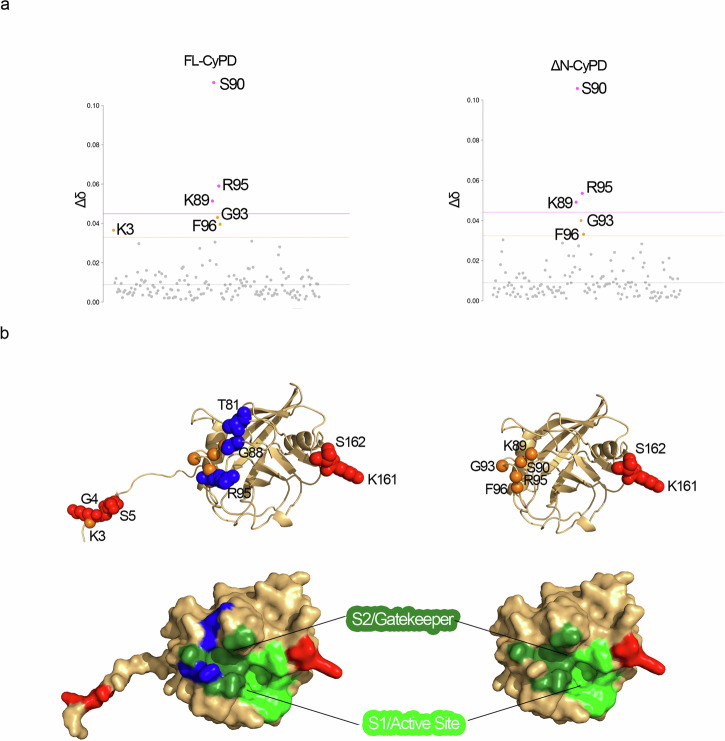
Fig. 5. Effect of KCl on structure and dynamics of FL-CyPD and ΔN-CyPD.
a CSP analysis of FL-CyPD (left panel) and ΔN-CyPD (right panel) after the addition of 150 mM KCl. Data points are coloured according to the chemical shift perturbation: pink points have a Δδ higher than S.D. (pink dotted line), orange points have a Δδ higher than S.D. (orange dotted line), grey points are non-perturbed residues. b KCl-induced variations plotted on the structures of FL-CyPD (left, Alphafold2 prediction) and ΔN-CyPD (right, PDB 2Z6W). Variations of chemical shifts shown in (a) are reported as orange spheres of the amide nitrogen of the corresponding residues. Lineshape variations were determined either considering the signal intensity or the integral at 0 mM KCl and at 150 mM KCl, only for those peaks that did not coalesce throughout the titration. Residues whose lineshape was significantly affected by salt addition are represented as spheres coloured in blue (signal intensity decrease) or red (signal intensity increase). The lower panel shows the surface representations of the above structures, showing the localization of the S2/gatekeeper and S1/active site regions and residues affected by KCl colored as above.

