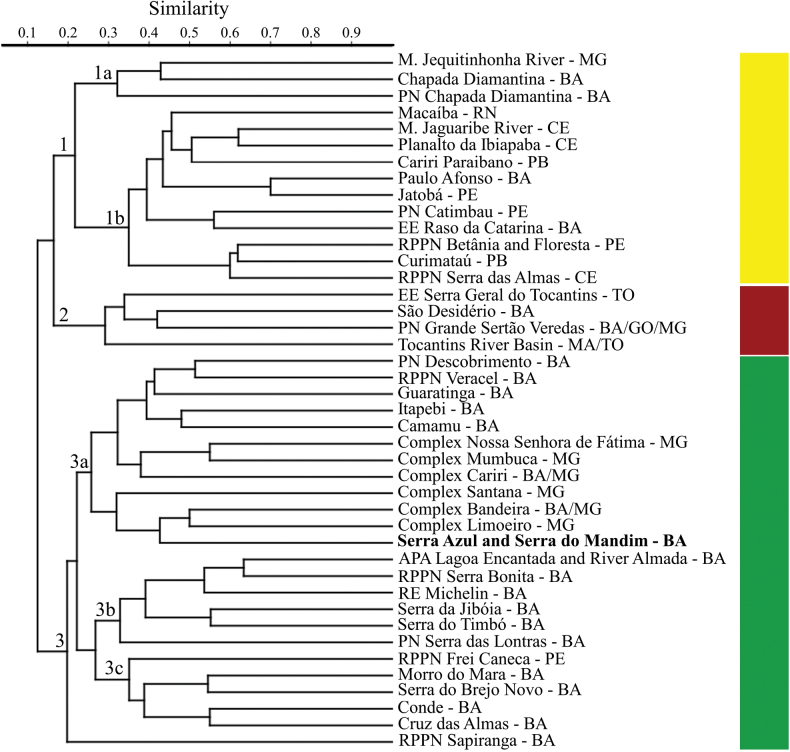
Figure 6.
Similarity dendrogram for 42 locations, comparing amphibian composition primarily in the northeast region of Brazil. Jaccard index for dissimilarity calculation and UPGMA (Unweighted Pair Group Method with Arithmetic) clustering method (cophenetic correlation coefficient = 0.798). Green: locations sampled in the Atlantic Forest; Red: locations sampled in the Cerrado; Yellow: locations sampled in the Caatinga.

