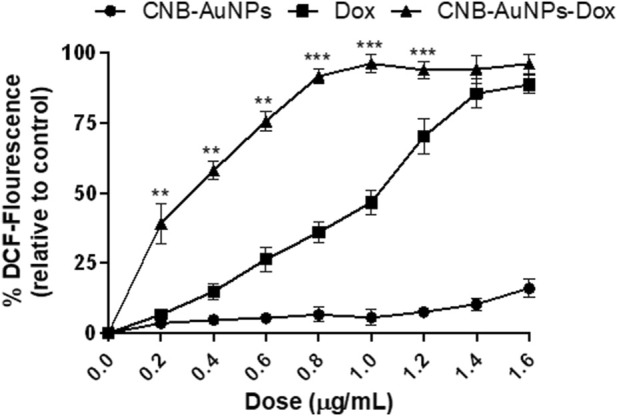
FIGURE 10.

Quantitative determination of ROS in H2DCFDA-stained A549 cells treated with various concentrations of CNB-AuNPs-Dox, Dox, and CNB-AuNPs for 24 h. The results presented are the mean ± SD of three independent experiments performed in triplicate. Significance among different dosage groups was determined using two-way ANOVA followed by Tukey’s multiple comparison tests (where *p < 0.05, **p < 0.01, and ***p < 0.001 represent significant differences between means of different treatment groups).
