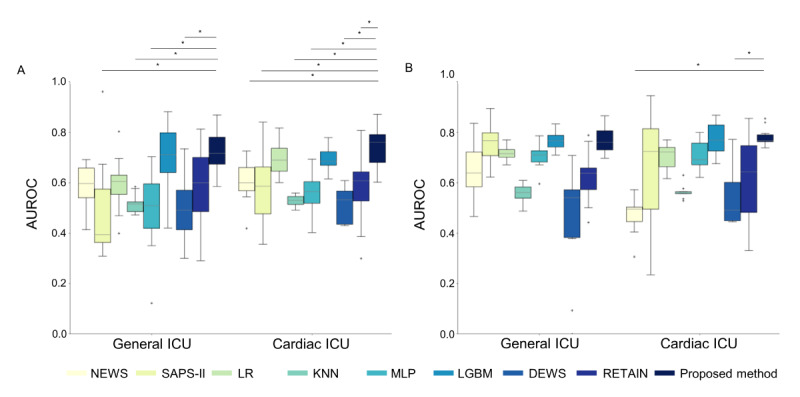
Figure 4.

Model performance in difference patient cohorts from MIMIC-IV and eICU-CRD. (A) AUROC on ICU types of MIMIC-IV. (B) AUROC on ICU types of eICU-CRD. Boxes in the box plot show IQR and the cross marks are outliers with values that lie outside the minimum and maximum ranges of the whiskers, where minimum = Q1 - 1.5 × IQR and maximum = Q3 + 1.5 × IQR. * Statistically significant (P<.05). AUROC: area under the receiver operating characteristic curve; DEWS: Deep Learning–Based Early Warning Score; eICU-CRD: eICU-Collaborative Research Database; ICU: intensive care unit; KNN: k-nearest neighbors; LGBM: light gradient boosting method; LR: logistic regression; MIMIC: Medical Information Mart for Intensive Care; MLP: Multilayer perceptron; NEWS: National Early Warning Score; Q1: first quartile; Q3: third quartile; RETAIN: reverse time attention; SAPS: Simplified Acute Physiology Score.
