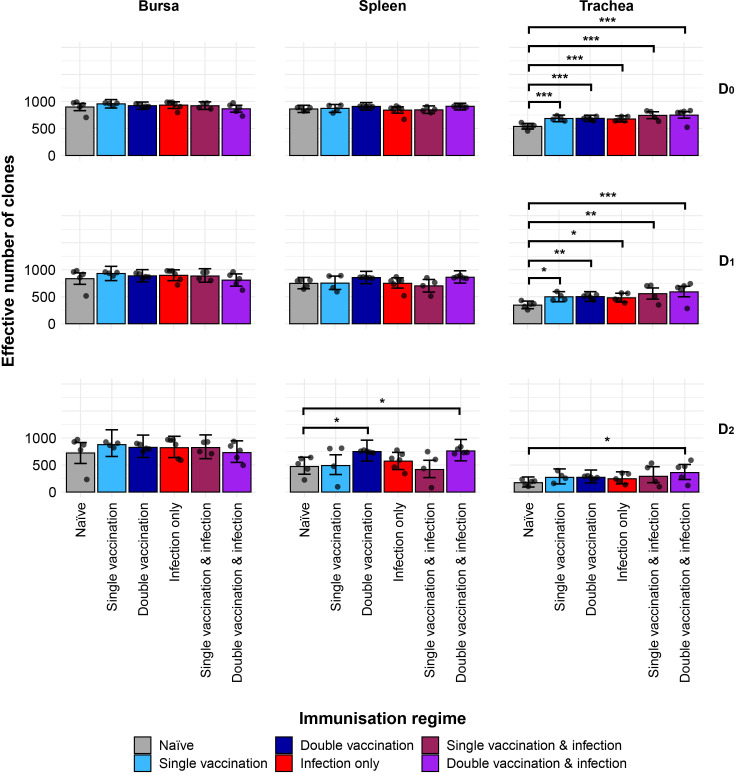
Figure 2.
IgM clonal diversity within samples. Different rows show the Hill numbers corresponding to clonal richness (D0), the “typical” clones (D1), and the “dominant” clones (D2) in a theoretical sample of 1,000 sequences. Immunisation regimes are colour-coded and displayed on the x-axis. Dots represent individual bird observations of the effective number of species calculated in each tissue for the corresponding H values. Error bars show the 95% bootstrap confidence intervals for the point estimates generated from 1,000 simulations of the model. Statistically significant differences between the model estimates are depicted above the plots based on their corresponding p-values: *p< 0.05; **p< 0.01; ***p< 0.001.

