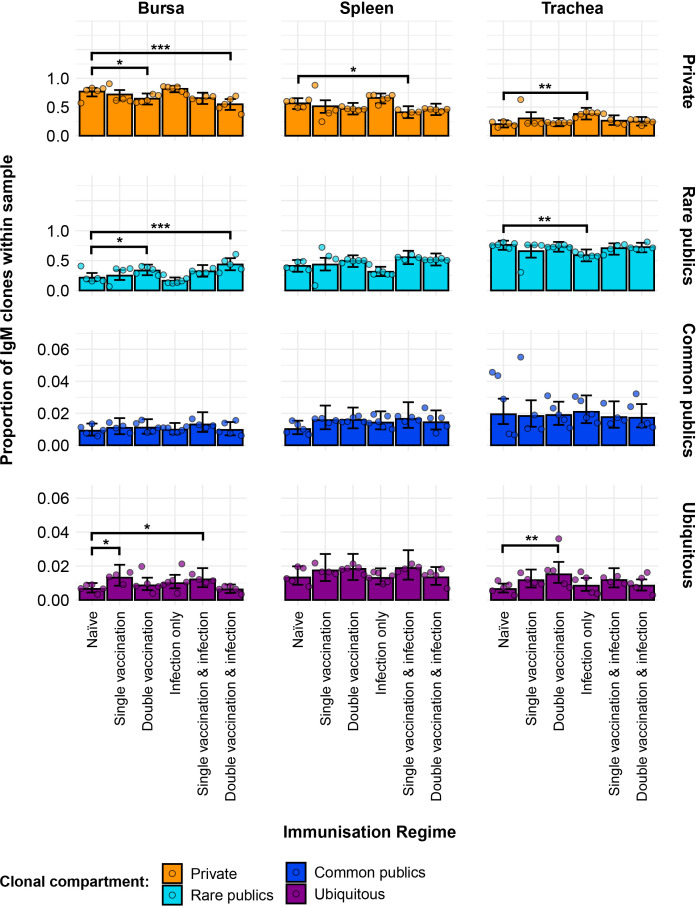
Figure 5.
Model estimates of IgM clone CDR3 nucleotide private and public compartments based on different levels of clonal sharing. Private (individual-restricted) clones are shown in orange. Rare publics (shared between two or more than two individuals up to 50%) are shown in light blue. Common publics (shared between more than 50% and up to 90% birds) are shown in dark blue. Ubiquitous publics (found in 90% or more of the birds that were incorporated in the analysis) are shown in purple. Dots represent individual bird observations of private and distinct public clonal compartments. Error bars represent 95% bootstrap confidence intervals for the point estimates generated from 1,000 simulations of the model. Statistically significant differences between the model estimates are depicted above the plots based on their corresponding p-values: *p< 0.05; **p< 0.01; ***p< 0.001.

